View the map or download the data
What is it?
What do I see on my screen?
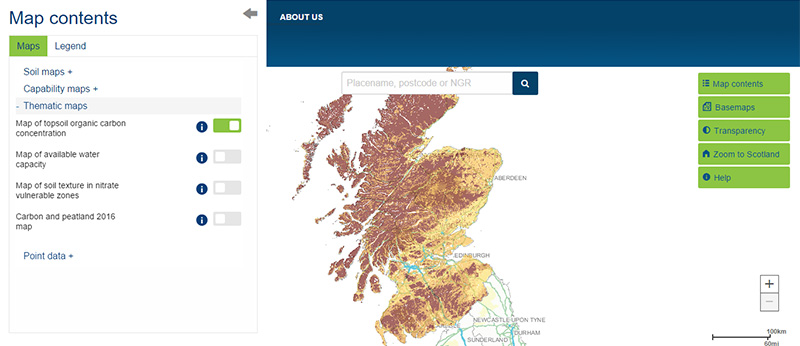
The map shows the concentration of organic carbon in the surface layer of soil.
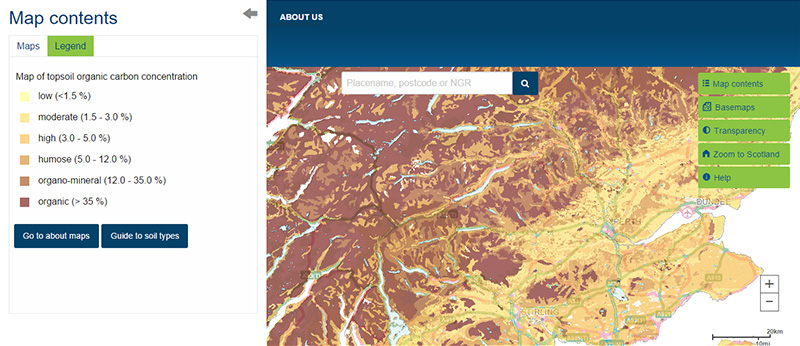
Map legend
The soil organic carbon concentration (%) is shown in the following categories
 |
Low - less than 1.5 % |
 |
Moderate - between 1.5 and 3 % |
 |
High - more than 3 to 5 % |
 |
Humose - more than 5 to 12 % |
 |
Organo-mineral - more than 12 to 35 % |
 |
Organic - greater than 35 % |
Cultivated soils usually have lower organic carbon concentrations in their surface layer (less than 5 %) than semi-natural soils.
What is included in the digital dataset?
The topsoil organic carbon concentration in this data set has been calculated using data from the Scottish Soils Knowledge and Information Base (SSKIB).
How was the map / dataset created?
The topsoil organic carbon map is based on the 1:250 000 soil map and calculated using data from the Scottish Soils Knowledge and Information Base (SSKIB). The topsoil carbon concentration of each soil type within the soil map unit was determined taking account of land cover. Missing data were firstly estimated using Loss on Ignition values derived from mineral and organic horizons; if this was not possible an indicative value was attributed from similar soil series. This map should be cited as: 'Lilly, A., Baggaley, N. & Donnelly, D. (2012). Map of soil organic carbon in top soils of Scotland. Map prepared for EU project GS-SOIL - Assessment and strategic development of INSPIRE compliant Geodata-Services for European Soil Data. ECP-2008-GEO-31800'.
How is it updated?
No updates to date
Using the map
What can I do?
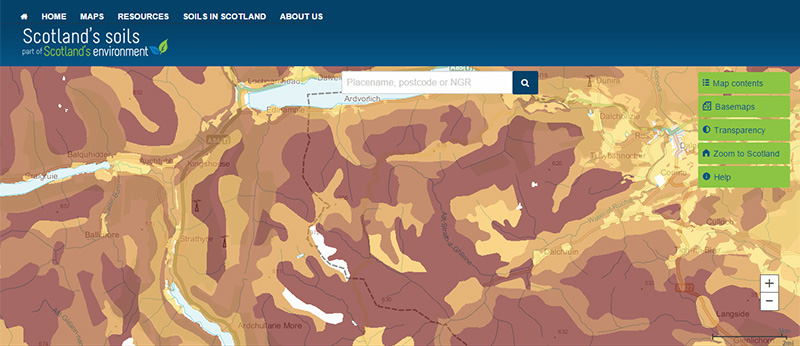
You can click on the map, or insert a grid reference or post code, to find out the carbon concentration in the surface layer of soil. You can also download the map data. The map covers the entire country and can be used to view regional differences in topsoil organic carbon concentrations.
Be aware: This map is produced at a fixed scale; zooming-in does not change the resolution of the map.
Technical and reference material
- Map of topsoil organic carbon concentration - SDDI Metadata file
This page was last updated on 25 May 2017
Adobe Acrobat Reader is the free, trusted leader for reliably viewing, annotating and signing PDFs.
Download Adobe Acrobat Reader


