View the map or download the data
What is it?
What do I see on my screen?
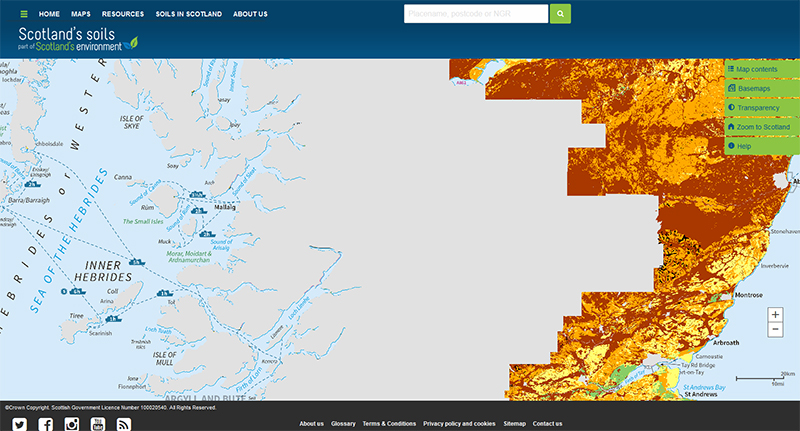
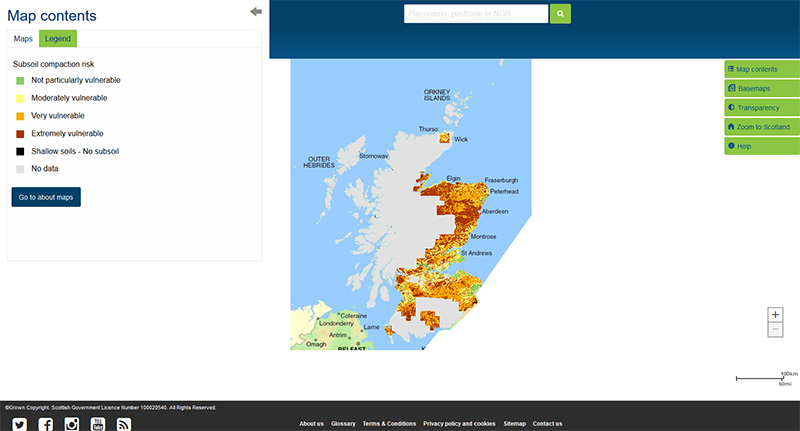
The map shows the vulnerability of subsoils to compaction by traffic. It covers most of Scotland’s cultivated agricultural land area.
Map legend
The vulnerability of subsoils to compaction is shown in 4 classes: Not particularly vulnerable, Moderately vulnerable, Very vulnerable and Extremely vulnerable.
 |
Not particularly vulnerable to subsoil compaction |
 |
Moderately vulnerable to subsoil compaction |
 |
Very vulnerable to subsoil compaction |
 |
Extremely vulnerable to subsoil compaction |
 |
Shallow soils - No subsoil |
 |
No data |
What is included in the digital dataset?
The subsoil compaction dataset gives information on the likelihood of the subsoil becoming compacted due to the traffic in four classes: Not particularly vulnerable, Moderately vulnerable, Very vulnerable or Extremely vulnerable.
How was the map / dataset created?
The subsoil compaction risk is determined from the soil texture, bulk density and the number of days in a year that the soil would be at its field capacity (that is, the amount of water left in the soil around 2 days after being saturated by rainfall).
Each of the soils in the Soil Map of Scotland (partial cover) dataset was assessed in terms of its soil texture and the predicted dry bulk density of the soil (see Jones et al., 2003). The soil texture and density were then combined to produce a susceptibility to subsoil compaction. As the strength of a soil also depends on its degree of wetness, the susceptibility assessment was combined with the number of days a soil is likely to be at field capacity (taken from Bibby et al., 1982) to give an overall vulnerability value. The vulnerability values were then assigned to one of four classes: Not particularly vulnerable, Moderately vulnerable, Very vulnerable or Extremely vulnerable. Where the soils were described as complexes (that is, more than one soil type is found in the area), the precautionary principle was applied and the soil at most risk of subsoil compaction was used to describe the whole map unit.
How is it updated?
The map will be updated when new areas of digitised soil information become available.
Using the map
What can I do?
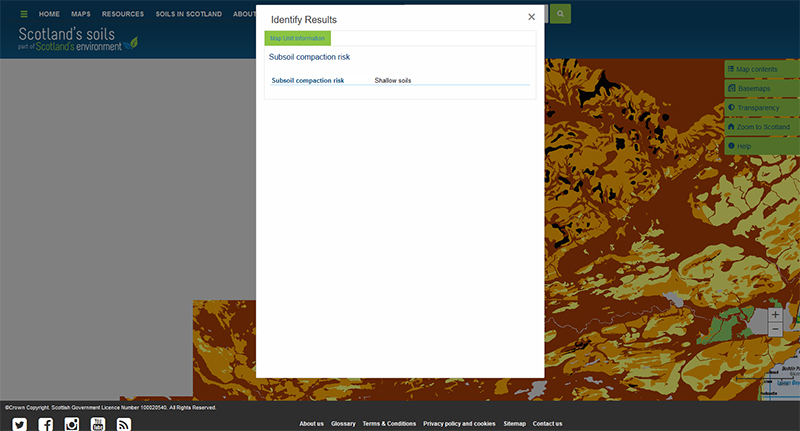
You can click on the map, or insert a grid reference or post code, to find out the risk of the subsoil compaction at that point. You can also download the map data from The James Hutton Institute data download page.
Be aware: This map is produced at a fixed scale; zooming-in does not change the resolution of the map.
Please cite as: Lilly, A. and Baggaley N.J. 2018. Subsoil compaction risk map of Scotland (partial cover). James Hutton Institute, Aberdeen.
This work was partly funded by the Rural & Environment Science & Analytical Services Division of the Scottish Government.
Technical and reference material
Bibby, J.S., Douglas, H.A., Thomasson, A.J. and Robertson, J.S. 1982. Land capability classification for agriculture. Soil Survey of Scotland Monograph. The Macaulay Institute for Soil Research. Aberdeen.
Jones, R. J. A., Spoor, G. & Thomasson, A. J. 2003. Vulnerability of subsoils in Europe to compaction: a preliminary analysis. Soil and Tillage Research, 73: 131-143.
SSDI Metadata file
This page was last updated on 18 May 2018
Adobe Acrobat Reader is the free, trusted leader for reliably viewing, annotating and signing PDFs.
Download Adobe Acrobat Reader


