View the map or download the data
What is it?
What do I see on my screen?
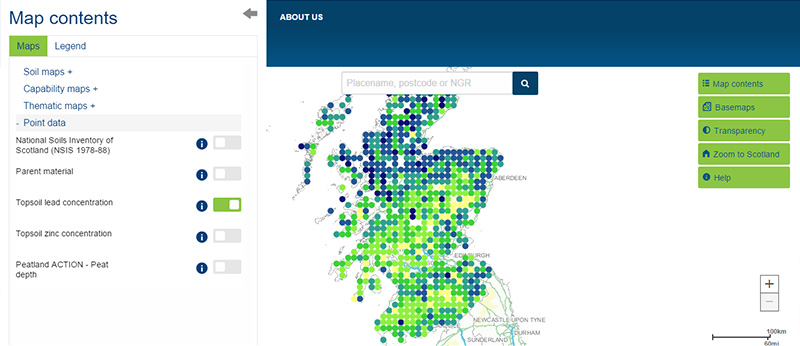
This map shows the location of the National Soil Inventory of Scotland sampling points. The colour of the symbol relates to the lead concentration of the topsoil found at that point (in parts per million of air-dried soil). The soils were sampled between 1978 and 1988 as part of the National Soil Inventory of Scotland.
Map legend
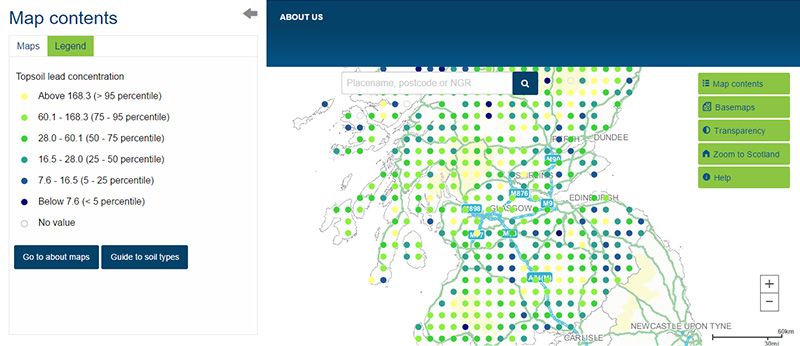
The Lead (Pb) concentration (parts per million of air-dried soil) is shown in the following categories:
 |
Pb concentration greater than 168.3 ppm |
 |
Pb concentration between 60.1 and 168.3 ppm |
 |
Pb concentration between 28.0 and 60.1 ppm |
 |
Pb concentration between 16.5 and 28 ppm |
 |
Pb concentration between 7.6 and 16.5 ppm |
 |
Pb concentration less than 7.6 ppm |
 |
No value |
What is included in the digital dataset?
Lead (Pb) concentration in the topsoil is reported in parts per million (ppm) of air dried soil from the National Soil Inventory of Scotland (NSIS 1978-88) dataset. Data was collected at sample locations arranged on a 10 km grid across the country. The map shows the location of each sampling point and the lead concentration in the topsoil.
How was the map /dataset created?
You can find out more about the protocols used to generate this map in the NSIS Soil location, sampling and profile description protocols and the Geochemical atlas for Scottish topsoils.
This map should be cited as: 'Paterson, E. (2011). Geochemical Atlas for Scottish Topsoils. Macaulay Land Use Research Institute, Aberdeen'.
How is it updated?
No update to date
Using the map
What can I do?
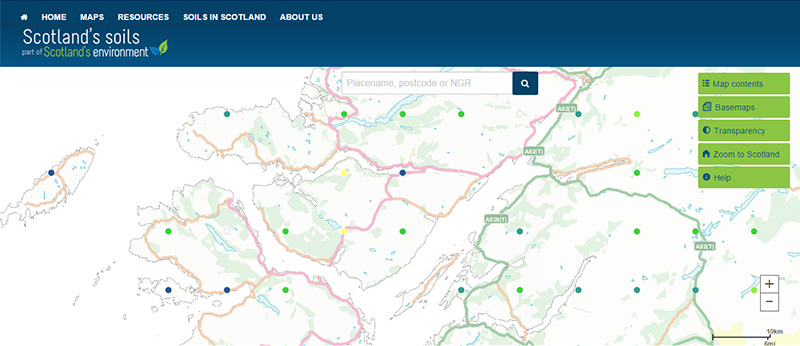
Click on the map to find out the lead concentration of the topsoil at each sampling location. The topsoil lead concentration is part of the National Soil Inventory of Scotland (NSIS 1978-88) dataset. You can download the whole dataset for Scotland.
You can use the map to see the regional differences in the lead concentration in Scottish topsoils.
Technical and reference material
This page was last updated on 25 May 2017
Adobe Acrobat Reader is the free, trusted leader for reliably viewing, annotating and signing PDFs.
Download Adobe Acrobat Reader


