View the map or download the data
What is it?
What do I see on my screen?
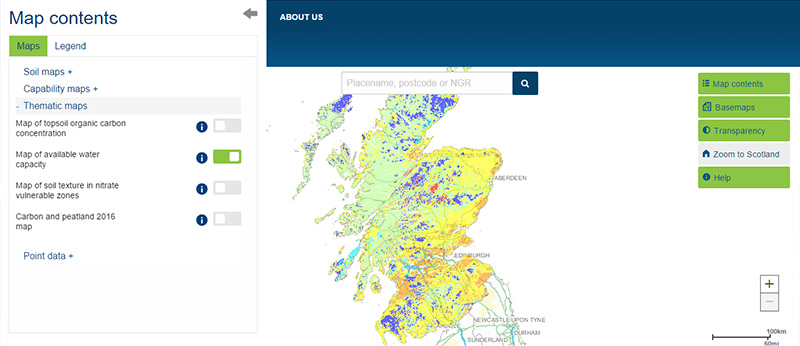
Available water capacity is the amount of water a soil can provide for plants and so is a useful indicator of the ability of soils to grow crops. The available water capacity is derived from a number of different soil properties.
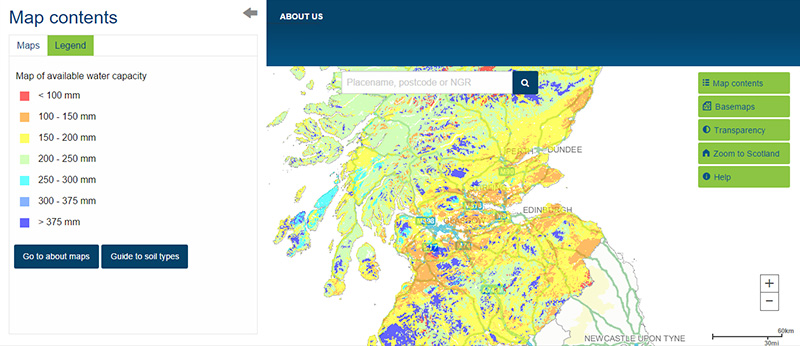
Map legend
The available water capacity is shown in the following categories:
 |
less than 100 mm |
 |
between 100 and 150 mm |
 |
more than 150 to 200 mm |
 |
more than 200 to 250 mm |
 |
more than 250 to 300 mm |
 |
more than 300 to 375 mm |
 |
greater than 375 mm |
Low values are indicative of a water deficiency, high values indicate a potential water excess.
What is included in the digital dataset?
The available water capacity gives information on the water available for plant growth. It is calculated from other soil properties and is the amount of water found in the top 1 m of soil after any excess has drained away (known as the field capacity) and before the permanent wilting point (when there is not enough water in the soil to support plant growth/life).
How was the map / dataset created?
The available water capacity map is based on the 1:250 000 soil map and calculated using data from the Scottish Soils Knowledge and Information Base (SSKIB). The available water capacity of each soil type within a soil map unit was determined taking into account whether the soil was cultivated or not. Due to a limited amount of measured data for all soils, the proportion of water held in the soil was calculated from other soil properties such as texture and organic matter content.
Regression equations published by Hollis et al. (2015) were used to calculate the proportion of water held at field capacity (5 kPa) and at the permanent wilting point (1500 kPa). The available water capacity was then calculated by subtracting the proportion of water held at the permanent wilting point from that held at field capacity for each soil layer in a soil profile representative of a particular soil type and then multiplying it by the thickness of each layer and summed for the entire soil profile to 1 m or to rock if the soil is <1 m thick. The map shows the averaged available water capacity calculated using the areal proportions of all soils in each 1:250 000 soil map unit.
The methods used are described in Gagkas, Z., Lilly, A. and Baggaley, N.J. 2018. Comparison of available water capacity predictions in Scotland from different PTFs: implications for modelling. British Society of Soil Science Annual Conference: Soils and Sustainable Development Goals, Lancaster University – 4th & 5th September 2018.
How is it updated?
The available water capacity map displayed on this website was produced in 2018 using UK-derived regression equations (Gagkas et al., 2018). It replaces the 2012 version of the map that was originally displayed.
The 2018 dataset differs significantly to the 2012 version because it uses different regression equations to predict available water capacities (Hollis et al., 2015) and bulk densities. In addition, the values shown are weighted averages by polygon rather than the available water capacity of the dominant soil type in the polygon.
The earlier version of map was published as Lilly, A., Baggaley, N. and Donnelly, D. 2012. Map of available water content to 1 metre depth in soils of Scotland. Map prepared for EU project GS-SOIL-Assessment and strategic development of INSPIRE compliant Geodata-Services for European Soil Data. ECP-2008-GEO-318004.
The 2018 version is published as Gagkas, Z., Lilly, A. and Baggaley, N.J. 2018. Comparison of available water capacity predictions in Scotland from different PTFs: implications for modelling. British Society of Soil Science Annual Conference: Soils and Sustainable Development Goals, Lancaster University – 4th & 5th September 2018.
Using the map
What can I do?
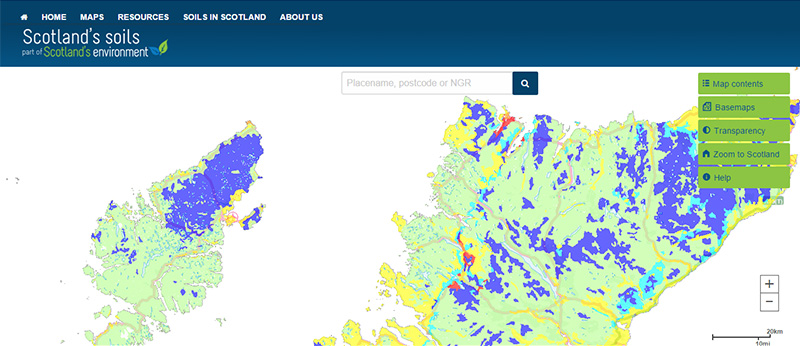
You can click on the map, or insert a grid reference or post code, to find out the available water capacity of the soil. You can also download the map data. The map covers the entire country and can be used to view regional differences in available water capacity.
Be aware: This map is produced at a fixed scale; zooming-in does not change the resolution of the map.
Technical and reference material
- Pedotransfer functions derived for soils in Scotland, Wales and England
- Map of available water capacity - SDDI Metadata file
- Hollis, J.M., Lilly, A., Higgins, A., Jones, R.J.A., Keay, C.A., Bellamy, P., 2015. Predicting the water retention characteristics of UK mineral soils. European Journal of Soil Science 66, 239-252.
This page was last updated on 25 Apr 2019
Adobe Acrobat Reader is the free, trusted leader for reliably viewing, annotating and signing PDFs.
Download Adobe Acrobat Reader


