View the map or download the data
What is it?
What do I see on my screen?
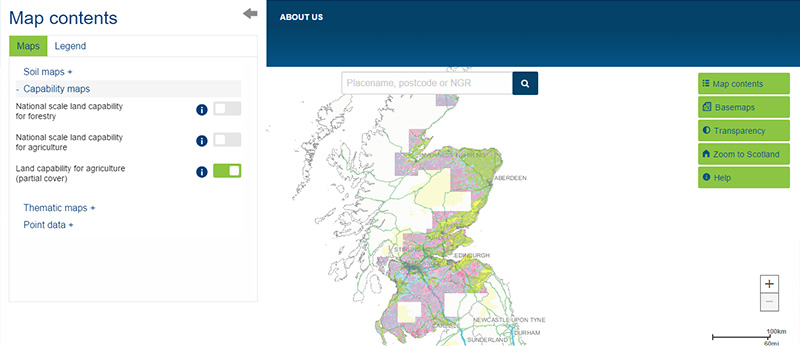
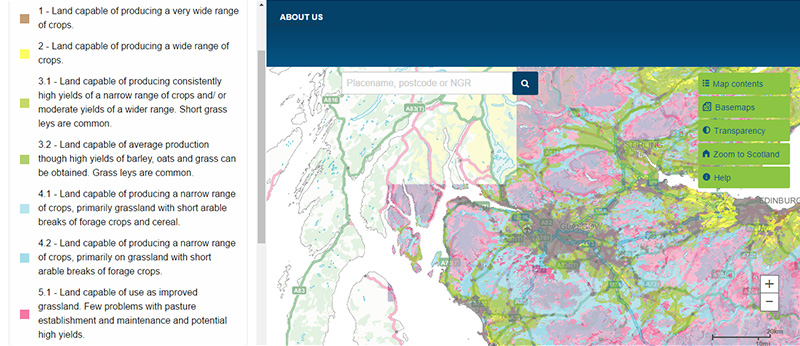
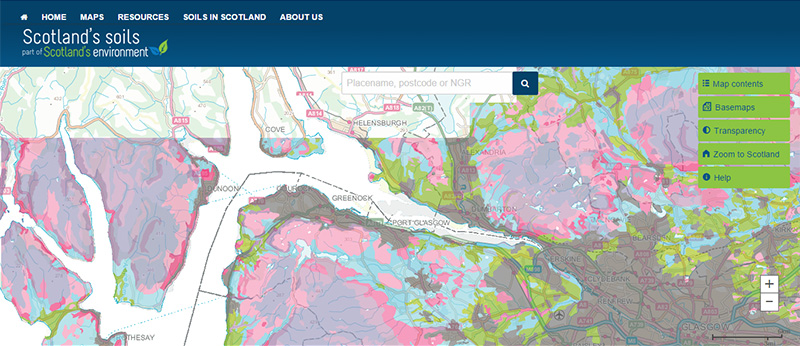
The Land capability for agriculture (partial cover) map provides information at a greater resolution than the national map on the types of crops that may be grown in different areas dependent on the environmental and soil characteristics.
Map legend
 |
Class 1 - Land capable of producing a very wide range of crops |
 |
Class 2 - Land capable of producing a wide range of crops |
 |
Class 3.1 - Land capable of producing consistently high yields of a narrow range of crops and/ or moderate yields of a wider range. Short grass leys are common |
 |
Class 3.2 - Land capable of average production though high yields of barley, oats and grass can be obtained. Grass leys are common |
 |
Class 4.1 - Land capable of producing a narrow range of crops, primarily grassland with short arable breaks of forage crops and cereal |
 |
Class 4.2 - Land capable of producing a narrow range of crops, primarily on grassland with short arable breaks of forage crops |
 |
Class 5.1 - Land capable of use as improved grassland. Few problems with pasture establishment and maintenance and potential high yields |
 |
Class 5.2 - Land capable of use as improved grassland. Few problems with pasture establishment but may be difficult to maintain |
 |
Class 5.3 - Land capable of use as improved grassland. Pasture deteriorates quickly |
 |
Class 6.1 - Land capable of use as rough grazings with a high proportion of palatable plants |
 |
Class 6.2 - Land capable of use as rough grazings with moderate quality plants |
 |
Class 6.3 - Land capable of use as rough grazings with low quality plants |
 |
Class 7 - Land of very limited agricultural value |
 |
Urban |
Classes 1 to 3.1 are known as prime agricultural land.
What is included in the digital dataset?
The digital dataset can be downloaded and contains information on the 'class' of soil. Soil classes range from Class 1 (land capable of producing a wide range of crops) to Class 7 (land of very little agricultural value). Land within Class 3 is subdivided to provide further information on potential yields; Classes 4 and 5 are further divided to provide information on grasslands and Class 6 is divided depending on the quality of the natural vegetation for grazing.
How was the map / dataset created?
The Land capability for agriculture map (partial cover) was originally published at 1:50 000 scale following extensive field verification and consultation with stakeholders. It shows the distribution of the different land classes across virtually all of Scotland’s cultivated agricultural land and adjacent uplands. The map should be cited as: 'Soil Survey of Scotland Staff (1984-87). Land Capability for Agriculture maps of Scotland at a scale of 1:50 000. Macaulay Institute for Soil Research, Aberdeen. DOI: 10.5281/zenodo.6322760'.
The method used to classify the land capability for agriculture is described in Land Capability Classification for Agriculture. As there are few climate stations in Scotland, a map showing the climate framework was developed. This Assessment of Climatic Factors in Land Capability for Agriculture in Scotland shows the maximum LCA class that can be attributed to an area if no other limitations exist.
How is it updated?
There are no plans to update the existing Land capability for agriculture maps. A digital platform has been developed to produce estimates of the land capability for agriculture under different climate change projections. At present, this is a research tool and does not replace the existing published land capability for agriculture classifications. The land capability for agriculture: building a tool to enable climate change assessments.
Using the map
What can I do?
You can click on the map, or insert a grid reference or post code, to find out more about the land capability for agriculture at that location. You can also download the map data.
This map covers most of Scotland's cultivated agricultural land and can be used to determine the areas most suited to growing crops or grazing livestock.
Be aware: This map is produced at a fixed scale; zooming-in does not change the resolution of the map.
Accessing original copies of the maps
Copies of the original maps were published in the 1980s as 30 separate 1:50 000 scale sheets with an associated handbook. They are still available for purchase The James Hutton Institute website.
Technical and reference material
This page was last updated on 11 Oct 2024
Adobe Acrobat Reader is the free, trusted leader for reliably viewing, annotating and signing PDFs.
Download Adobe Acrobat Reader


