Maps
Four main types of maps are available on this website, as well as point data relating to specific locations where soils have been sampled and analysed for a range of properties.
- Soil maps show the distribution of soils across the land.
- Capability maps classify land based on the potential for what it could grow and how well it could grow it.
- Thematic maps show the distribution of a specific soil property such as soil organic matter content.
- Risk maps show areas of soil at risk of erosion, runoff, leaching and compaction.
- Point data are data that relate to soils at a specific location.
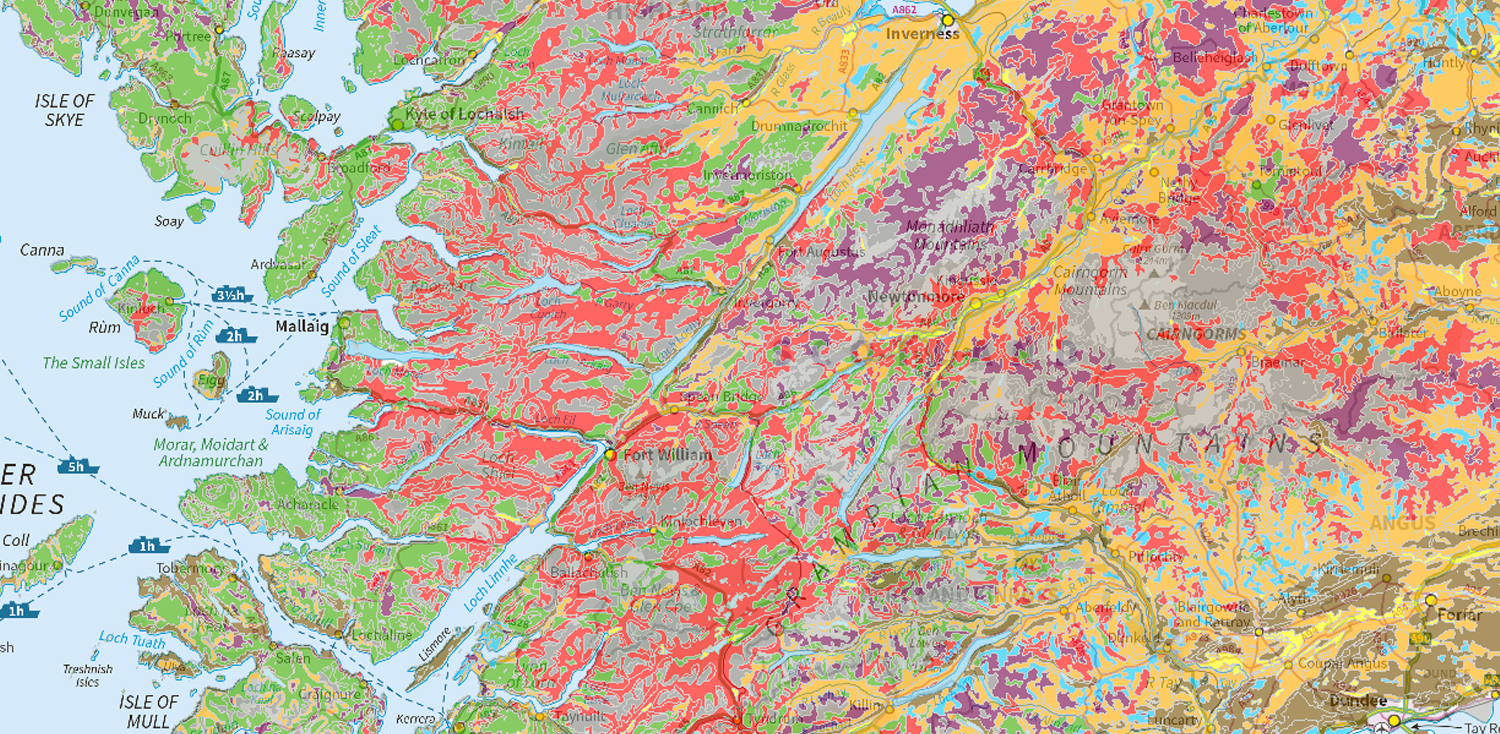
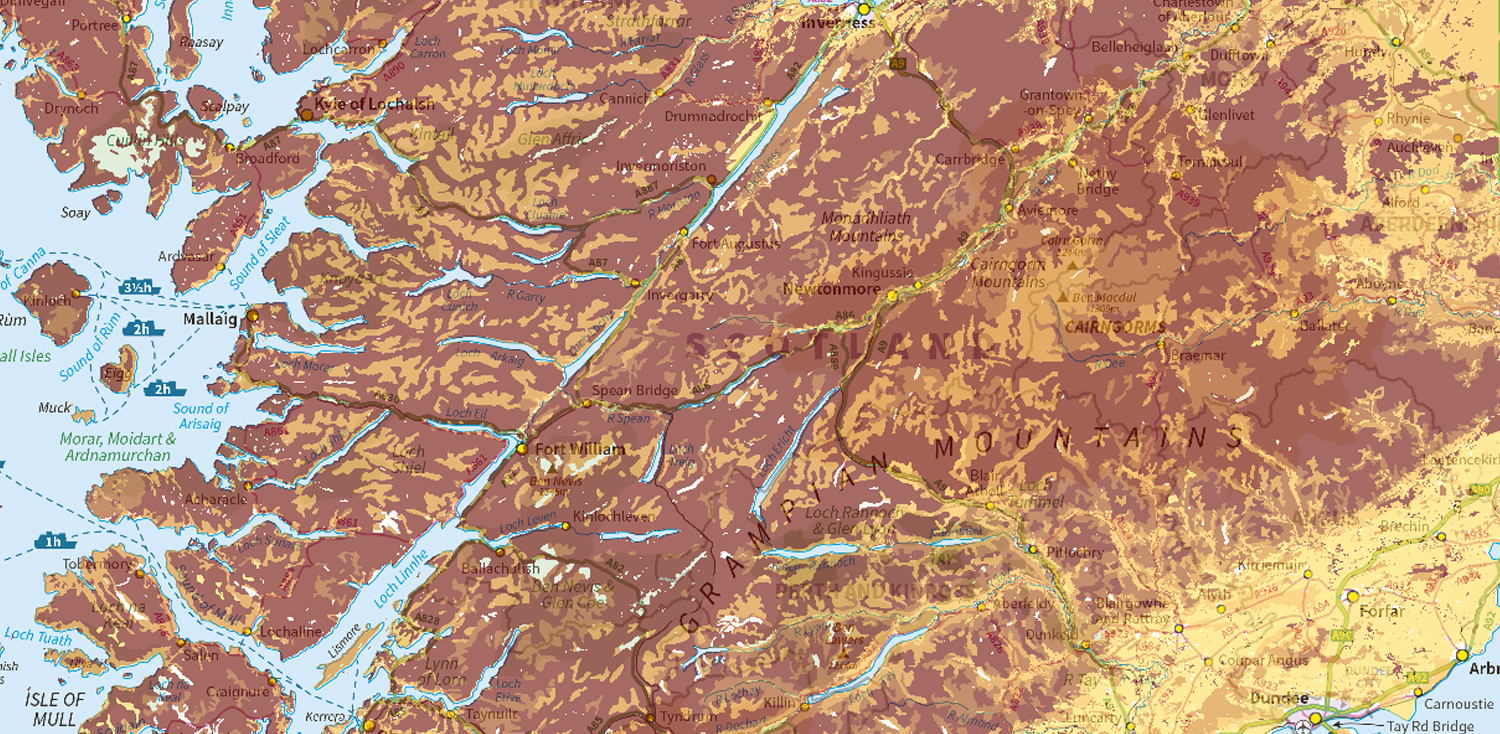
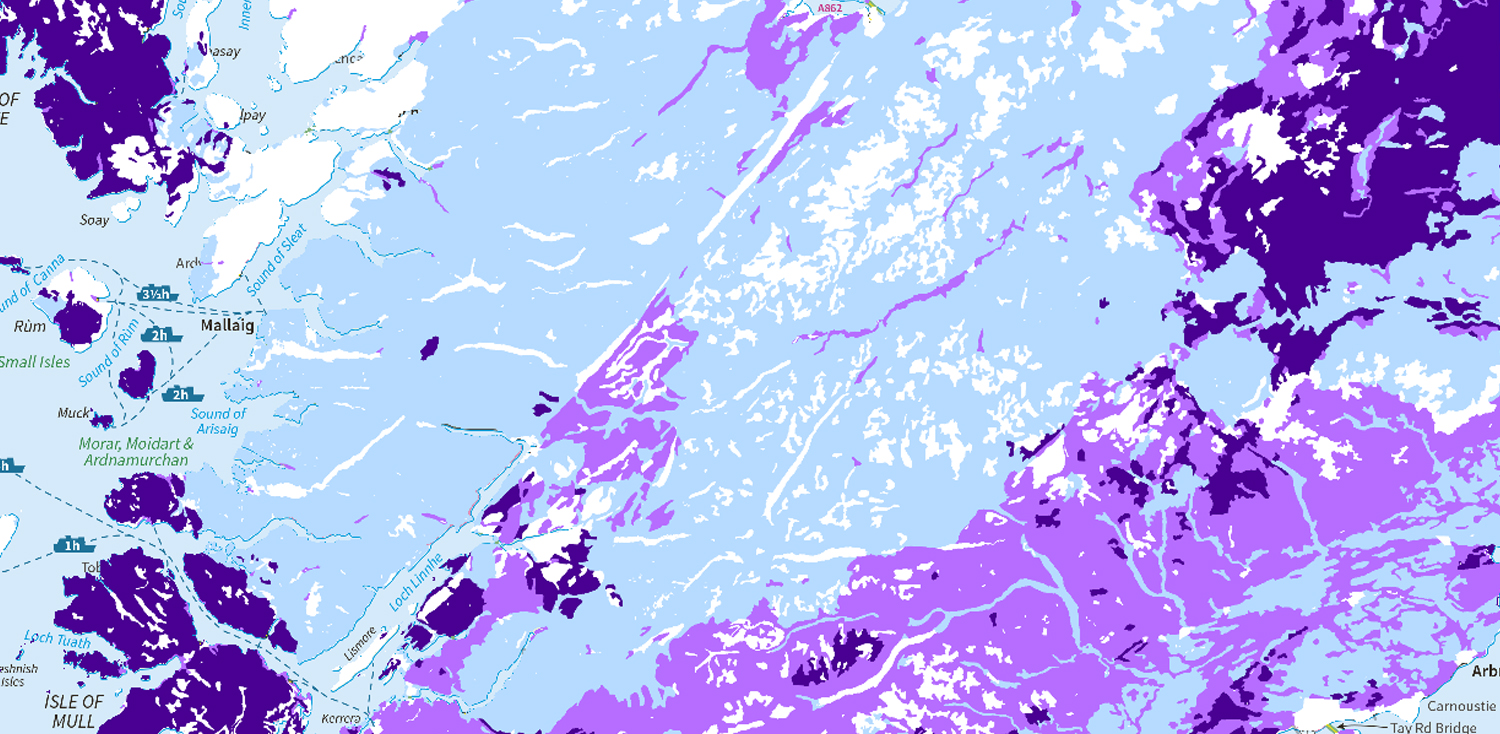
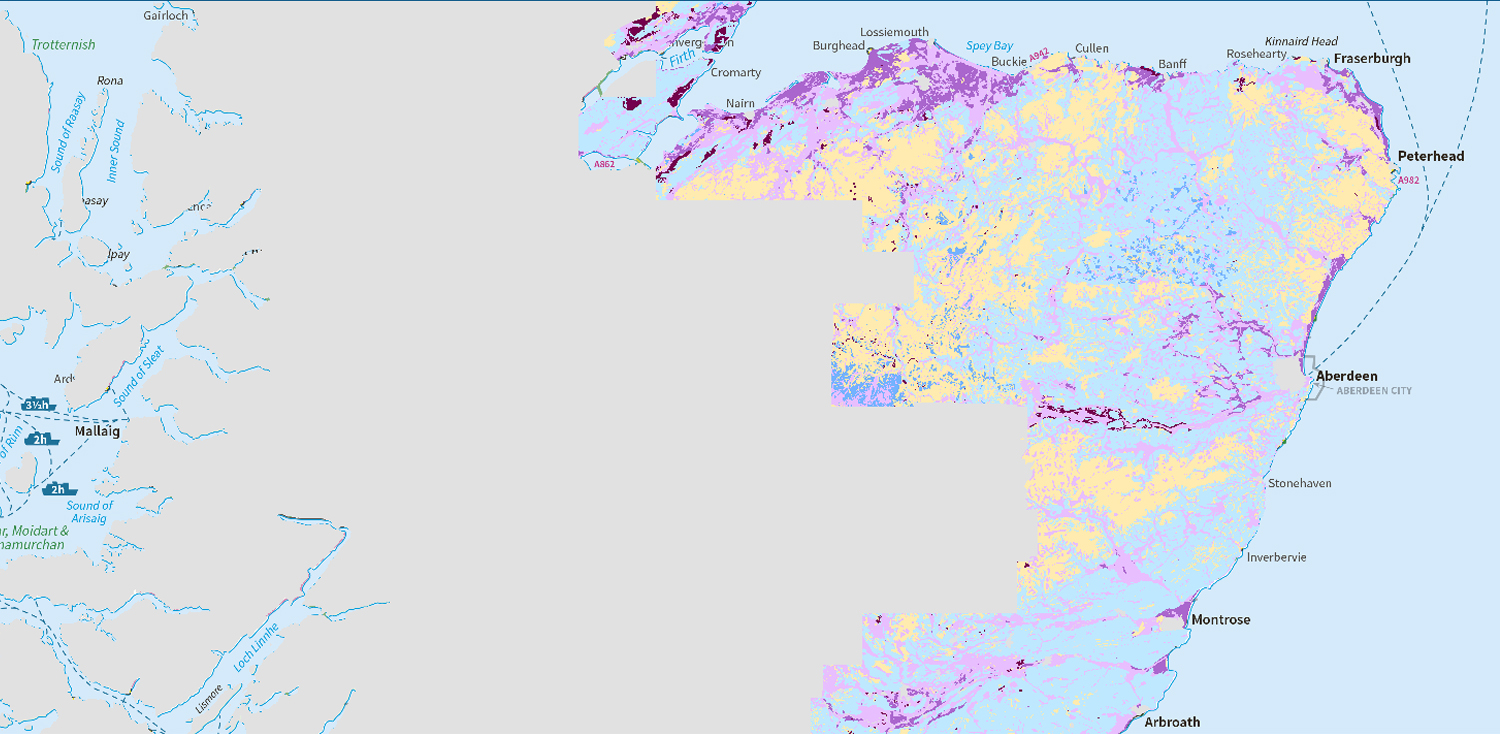
National soil map of Scotland
National coverage of the main soil types across Scotland mapped originally at 1:250 000 scale. The map is based on data collected between 1947 and 1981.
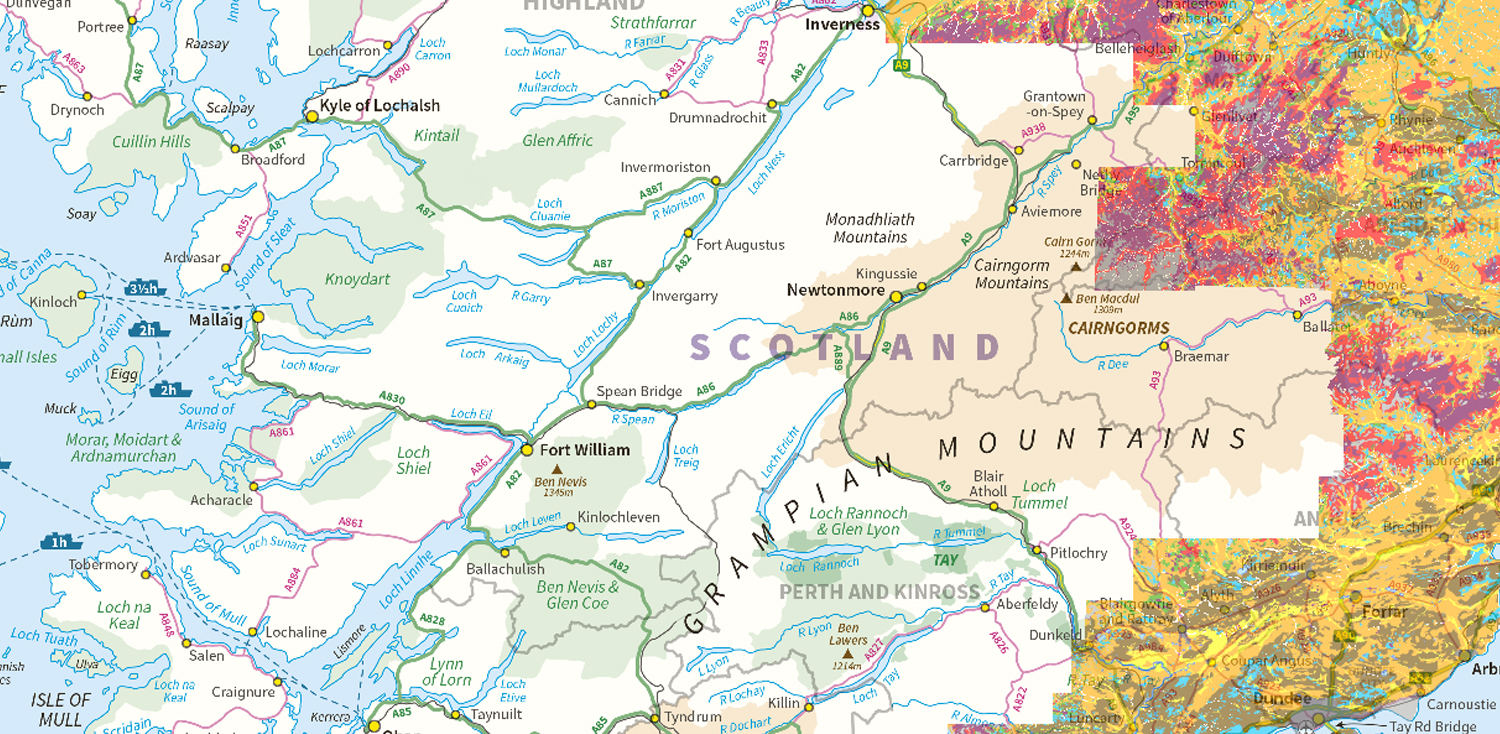
Soil map of Scotland (partial cover)
This map covers most of Scotland’s cultivated agricultural soils and some of the adjacent uplands. The soils were originally mapped at the 1:25 000 scale.
World Reference Base soil map
The World Reference Base is an international system for soil classification and correlation developed under the direction of the Food and Agriculture Organization of the United Nations (FAO).
Soil Survey of Scotland 1:250 000 scanned maps
Scanned copies of the original Soil Survey of Scotland maps at 1:250 000 scale can be downloaded. These maps were used to generate the digitised National soil map of Scotland.
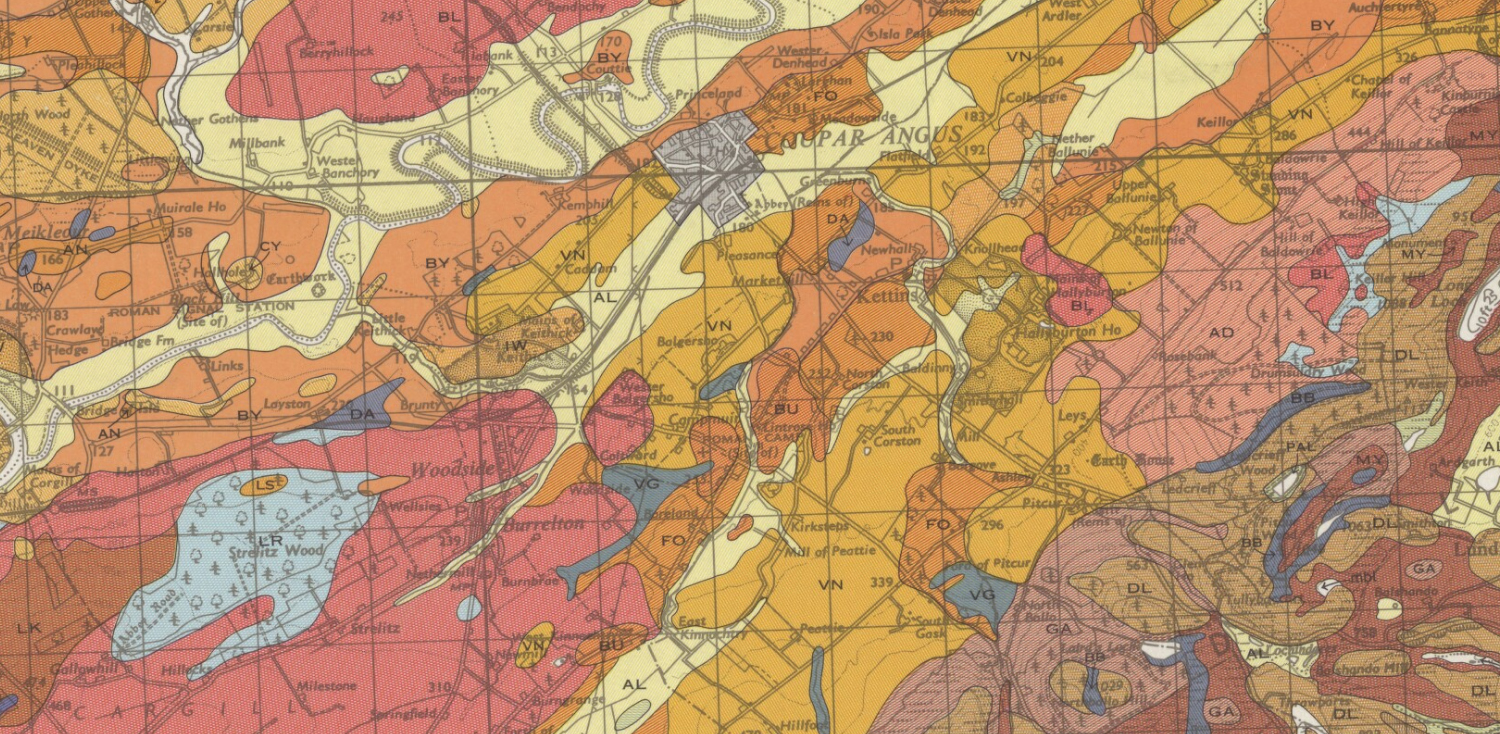
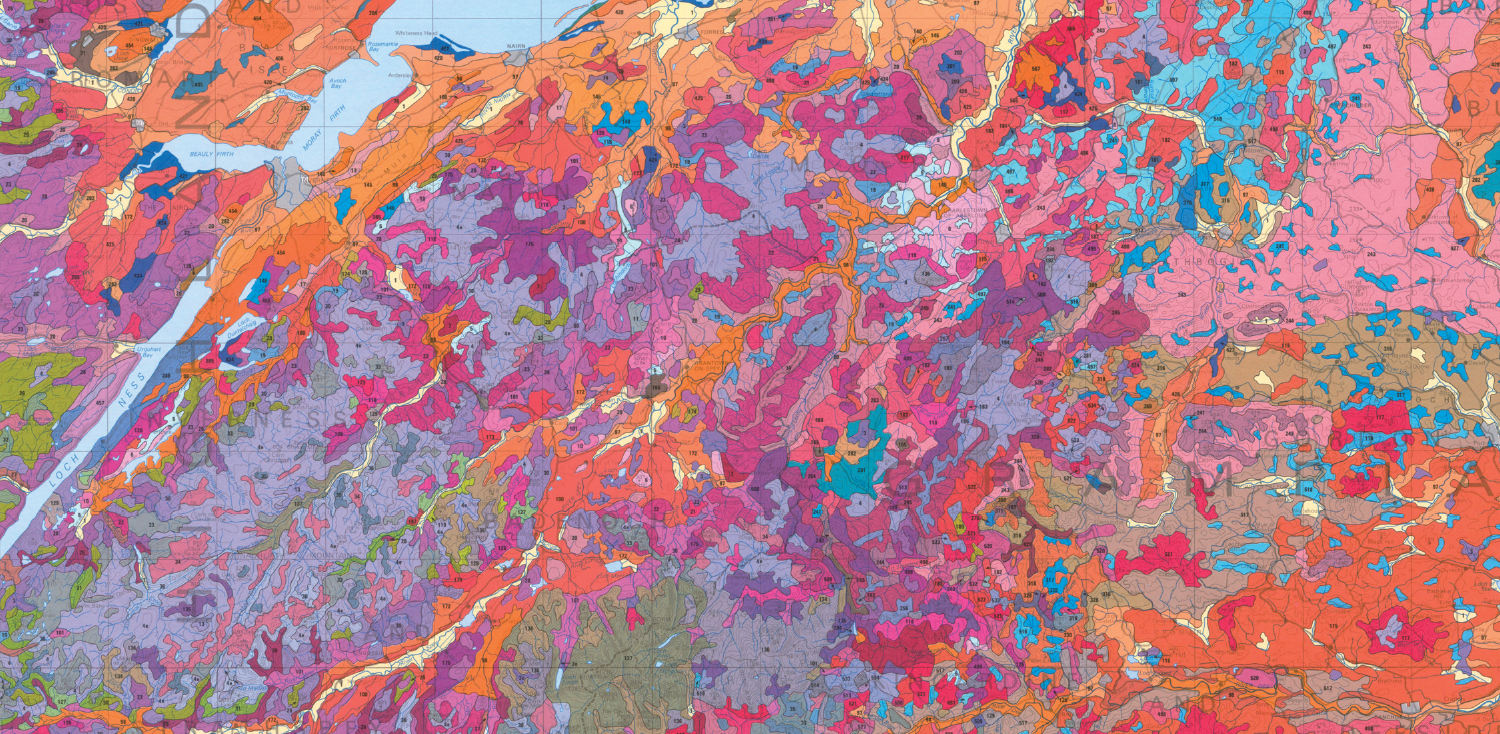
Soil Survey of Scotland 1:63 360 scanned maps
Scanned copies of many of the original Soil Survey of Scotland maps at 1:63 360 scale can be viewed online.
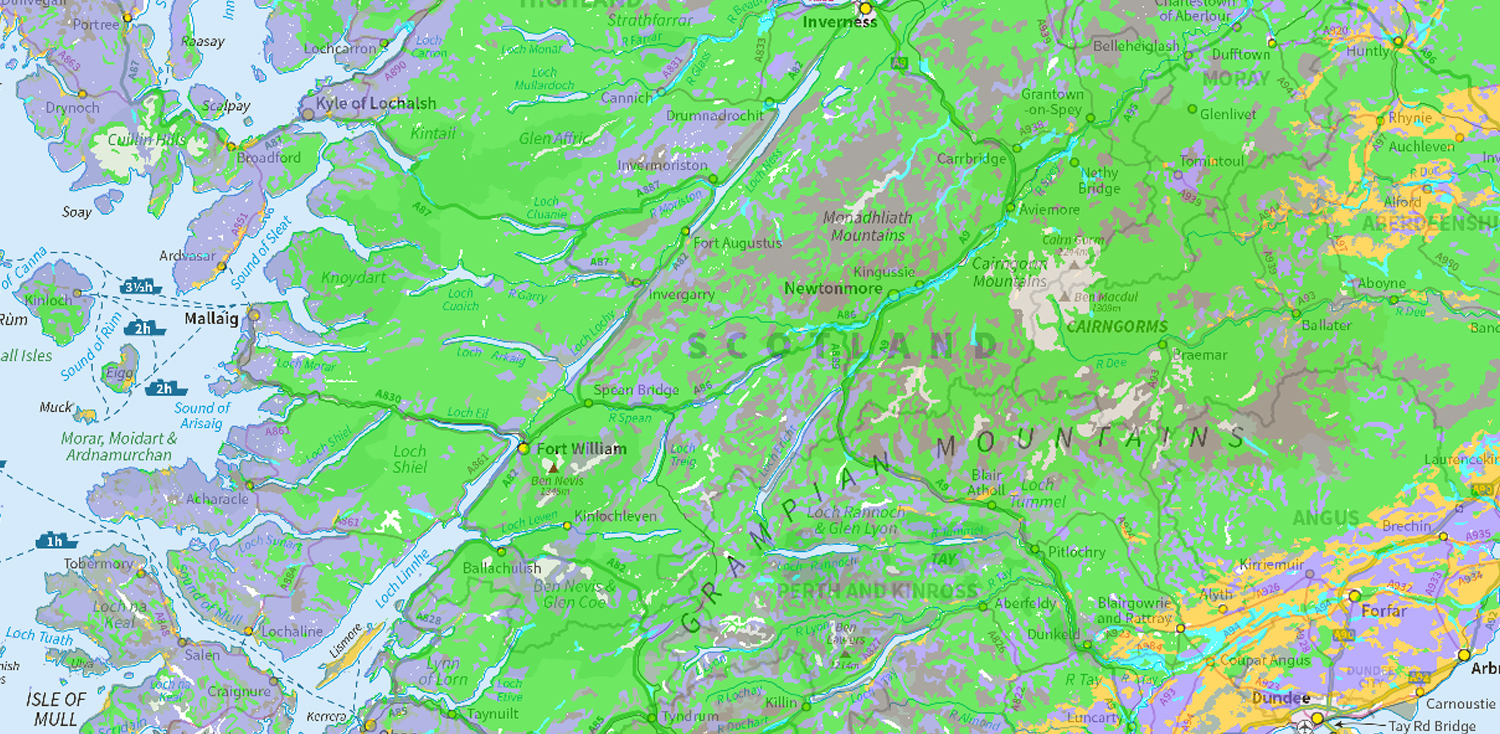
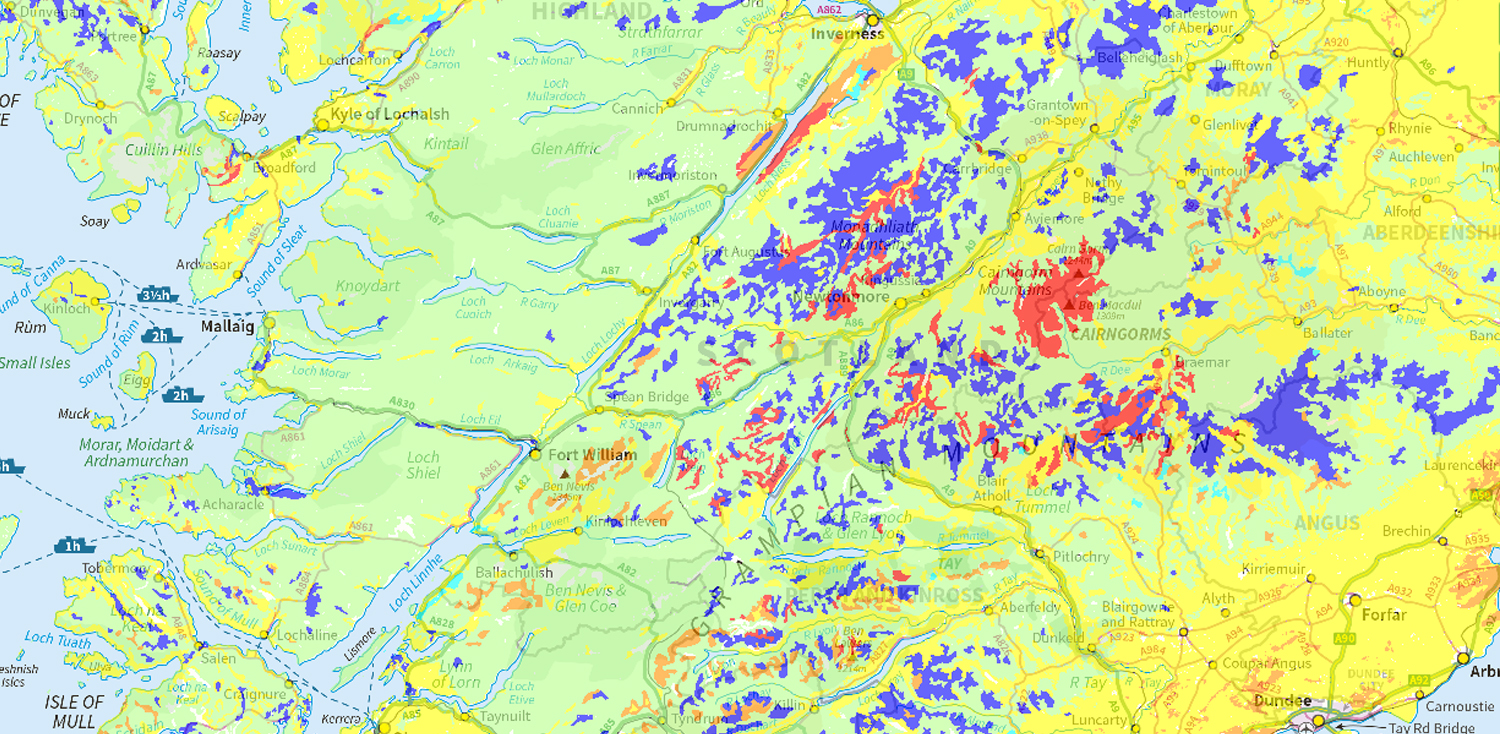
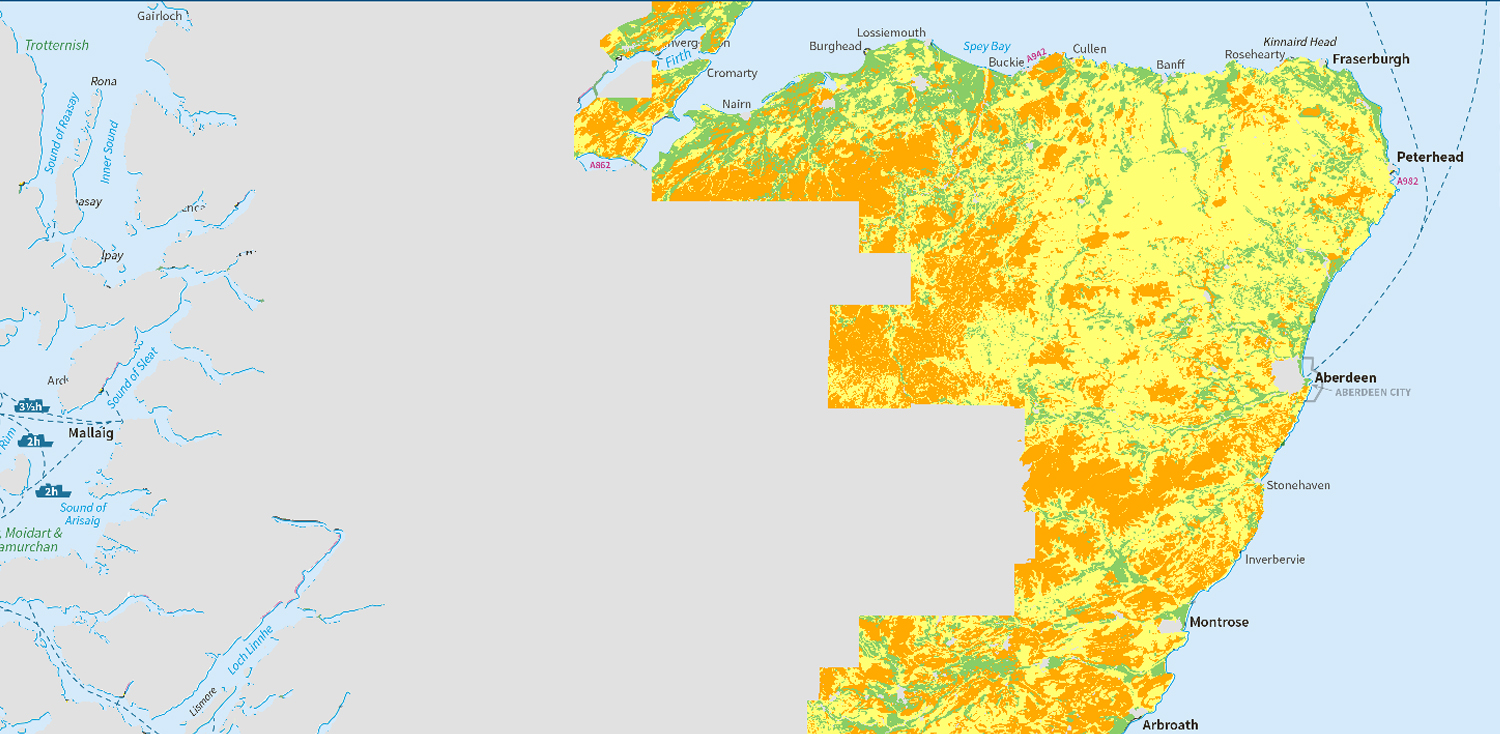
National scale land capability for forestry
The National scale land capability for forestry map provides information on the potential for land to grow trees based on a number of factors including soil, climate and topography.
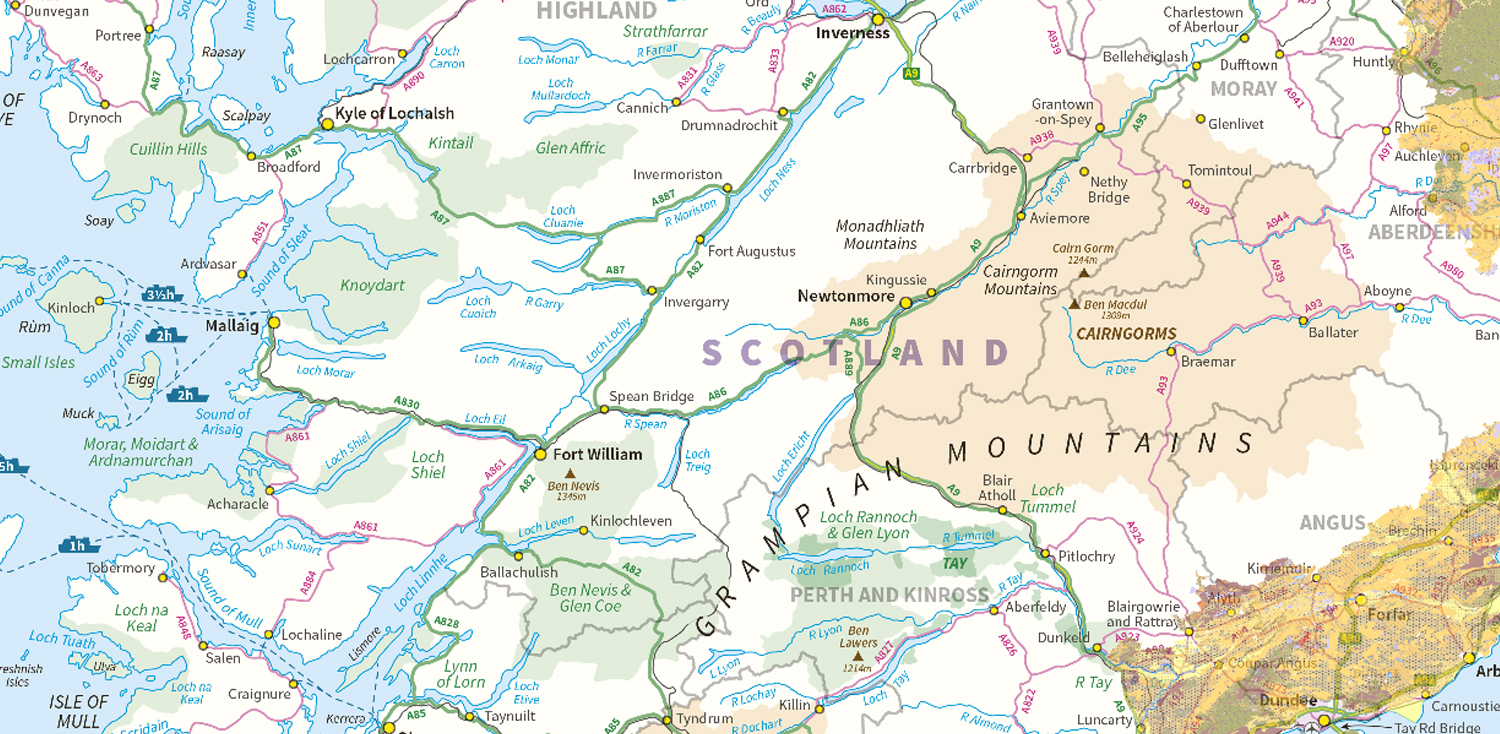
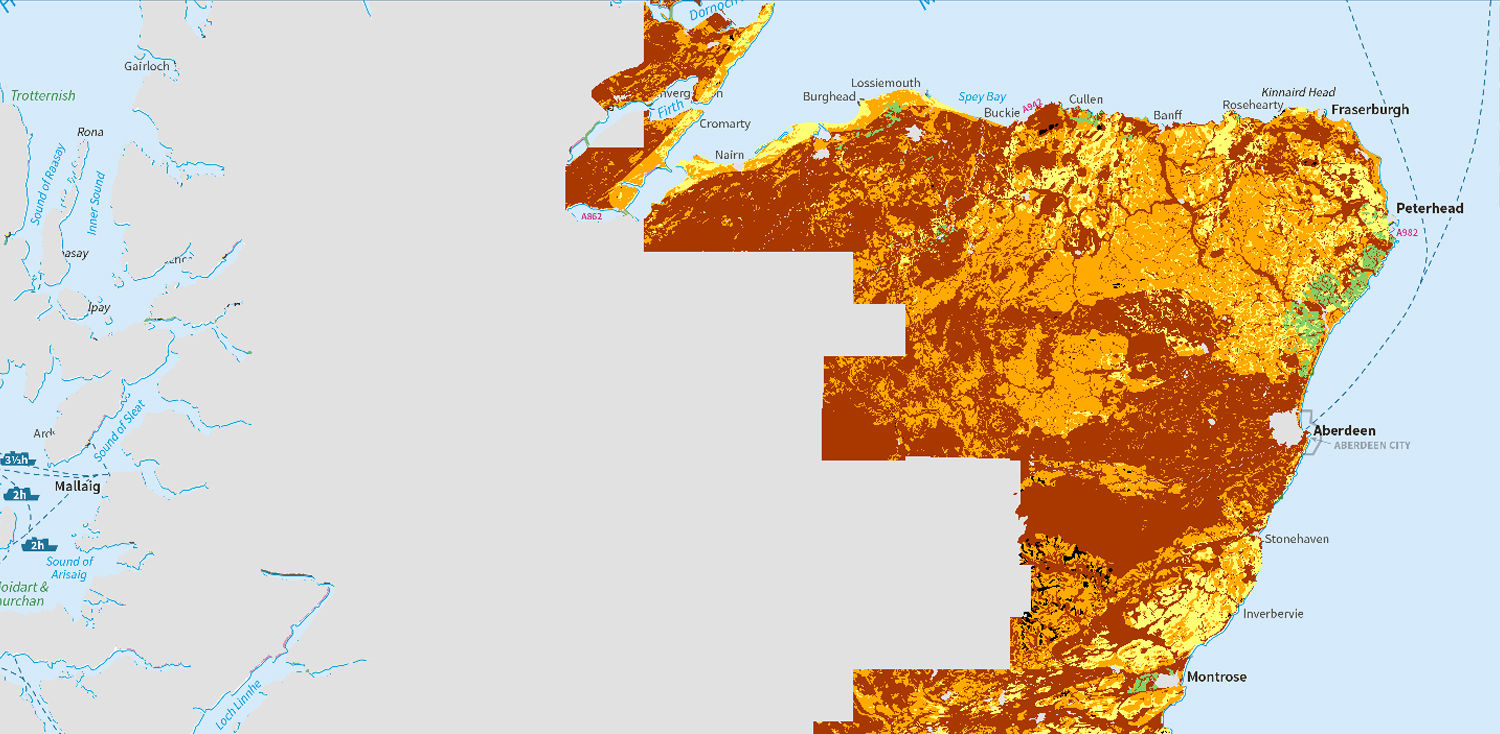
National scale land capability for agriculture
The National scale land capability for agriculture map provides information on the types of crops that may be grown in different areas dependent on environmental and soil characteristics.
Land capability for agriculture (partial cover)
The Land capability for agriculture (partial cover) map provides information at a greater resolution than the national map on the types of crops that may be grown in different areas dependent on the environmental and soil characteristics.
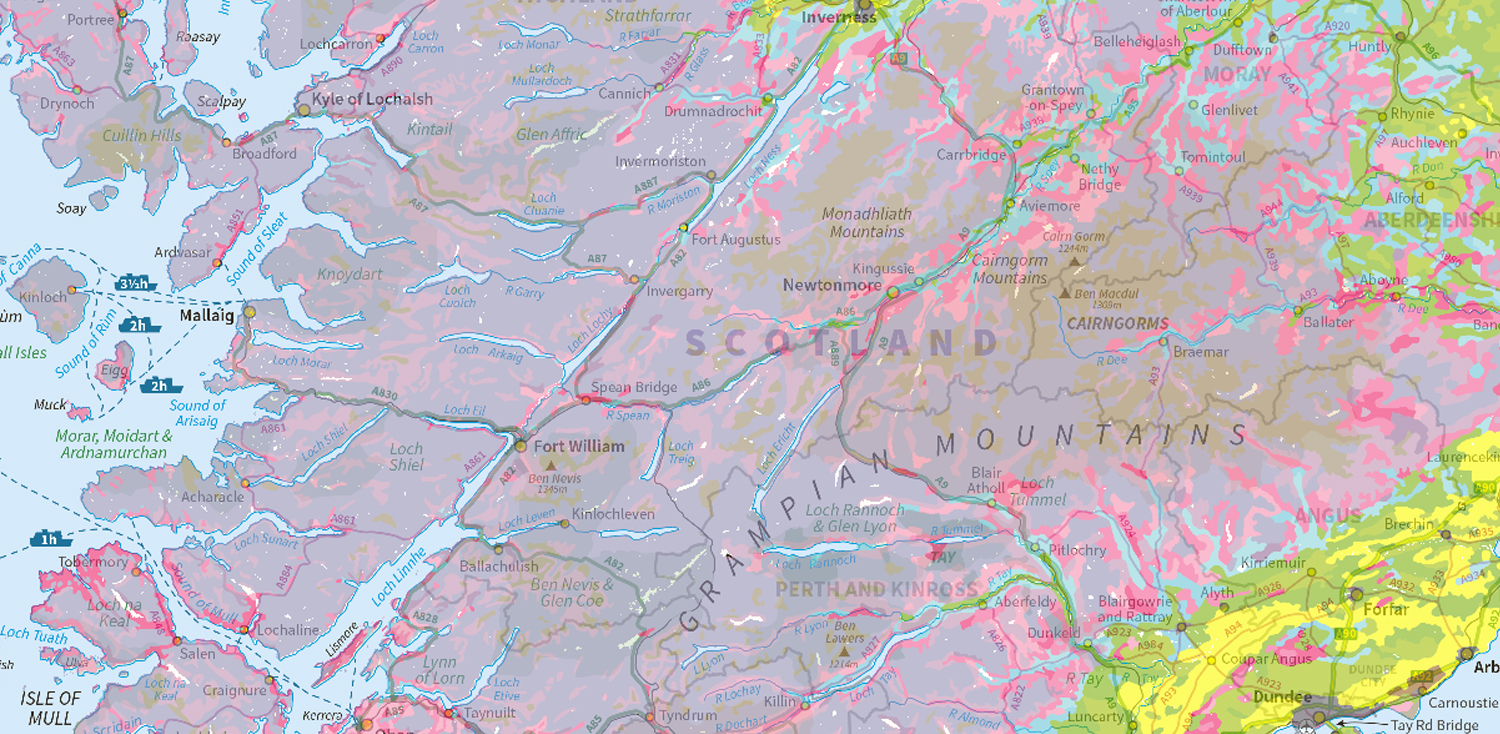
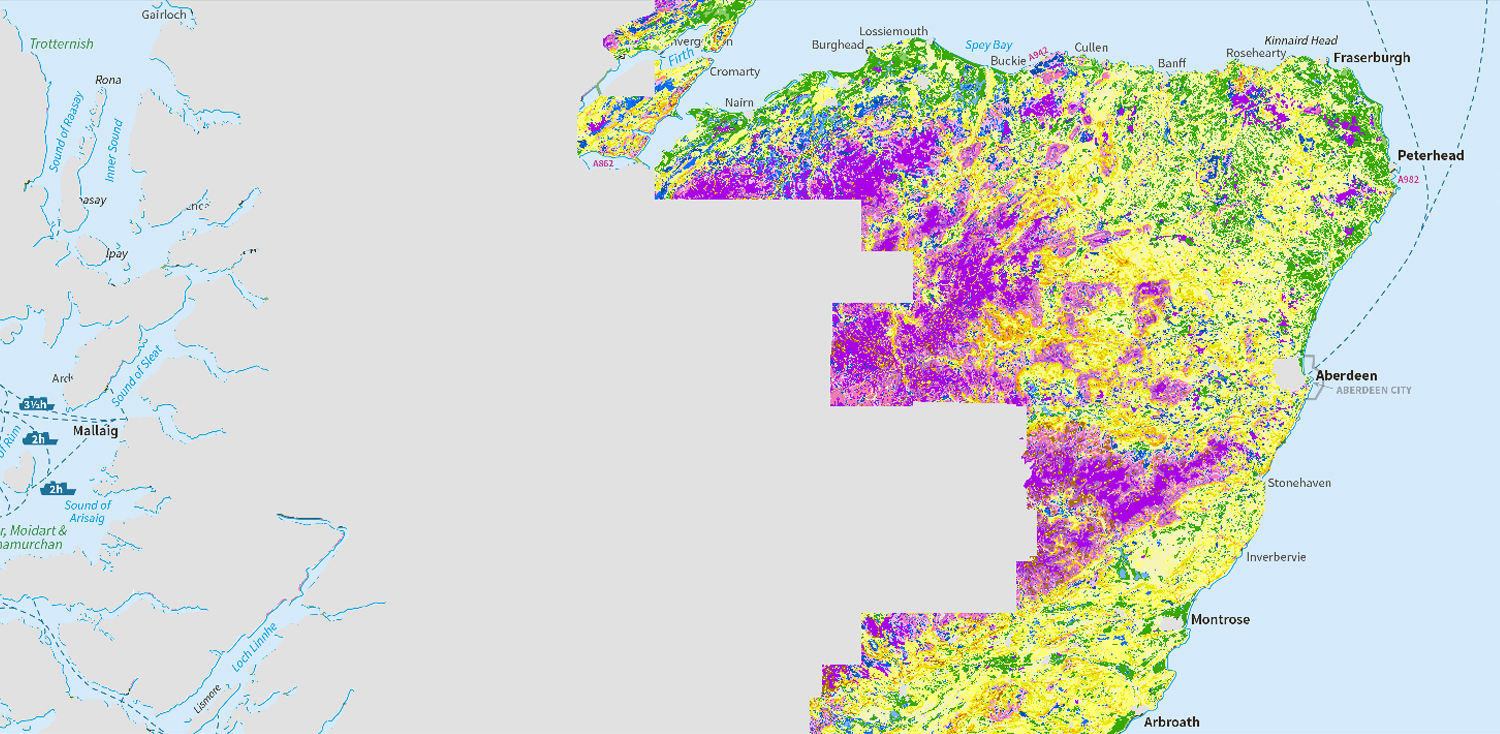
Map of topsoil organic carbon concentration
The map shows the concentration of organic carbon in the surface layer of soil.
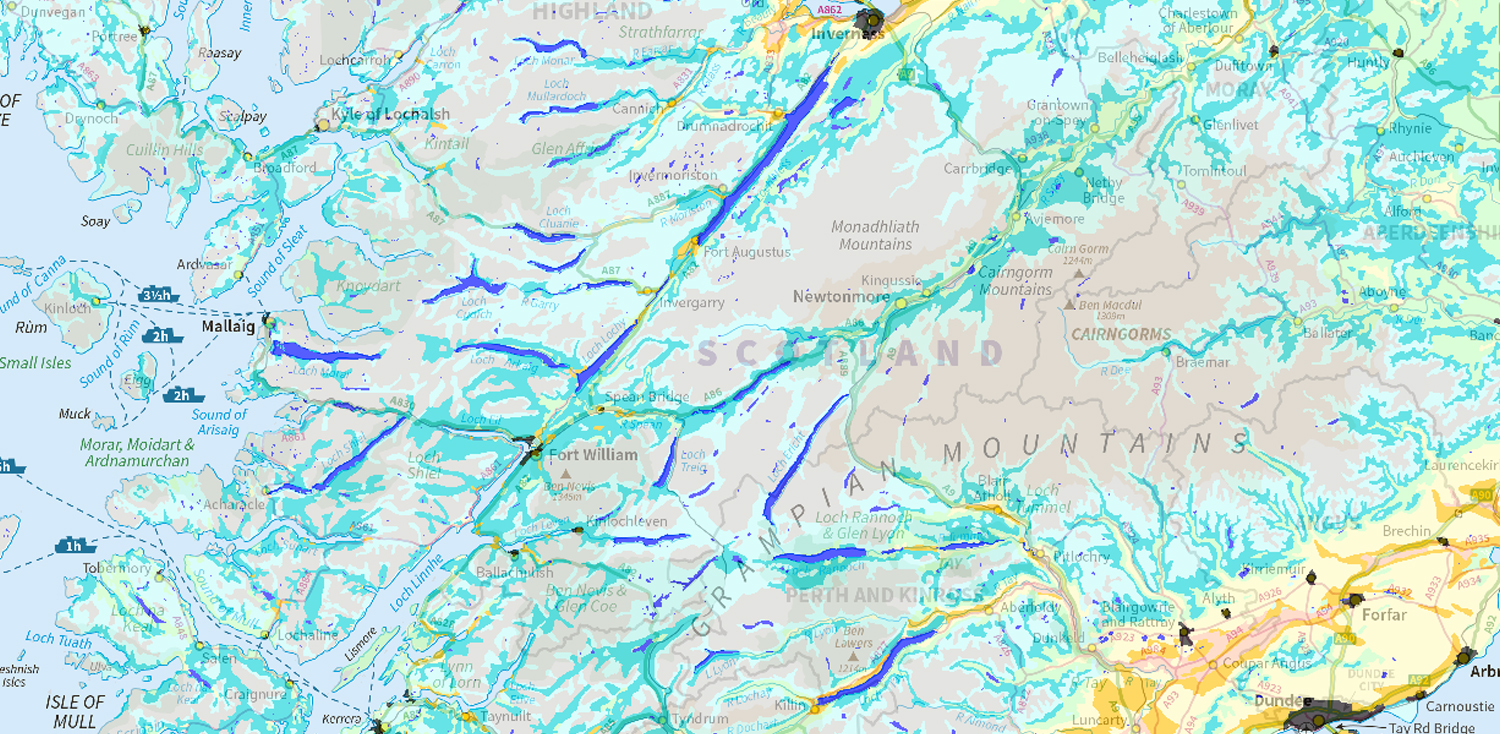
Map of available water capacity
Available water capacity is the amount water a soil can provide for plants and so is a useful indicator of the ability of soils to grow crops.
Map of soil texture in Nitrate Vulnerable Zones
Soil texture in Nitrate Vulnerable Zones (NVZs) provides information to help understand when and what management practices can be performed within NVZs.
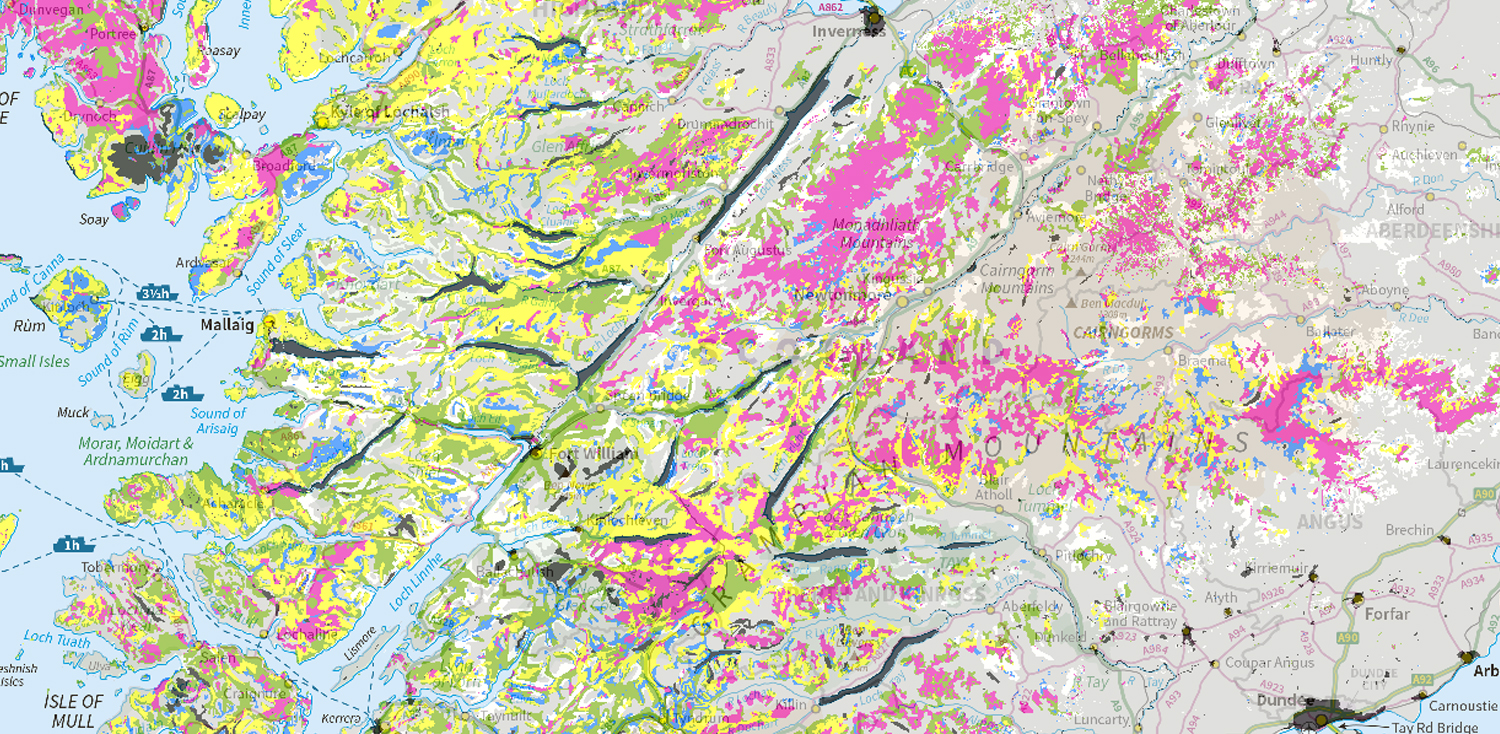
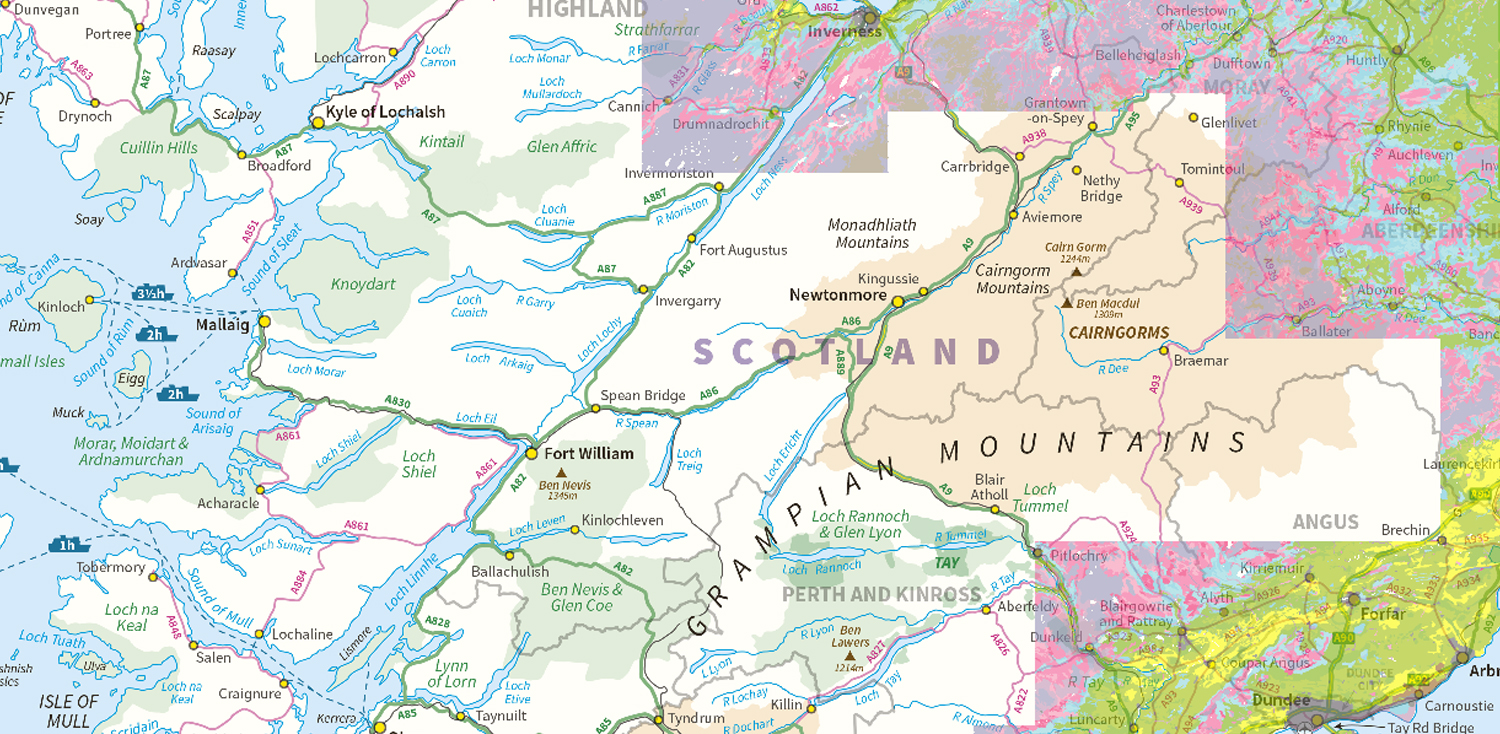
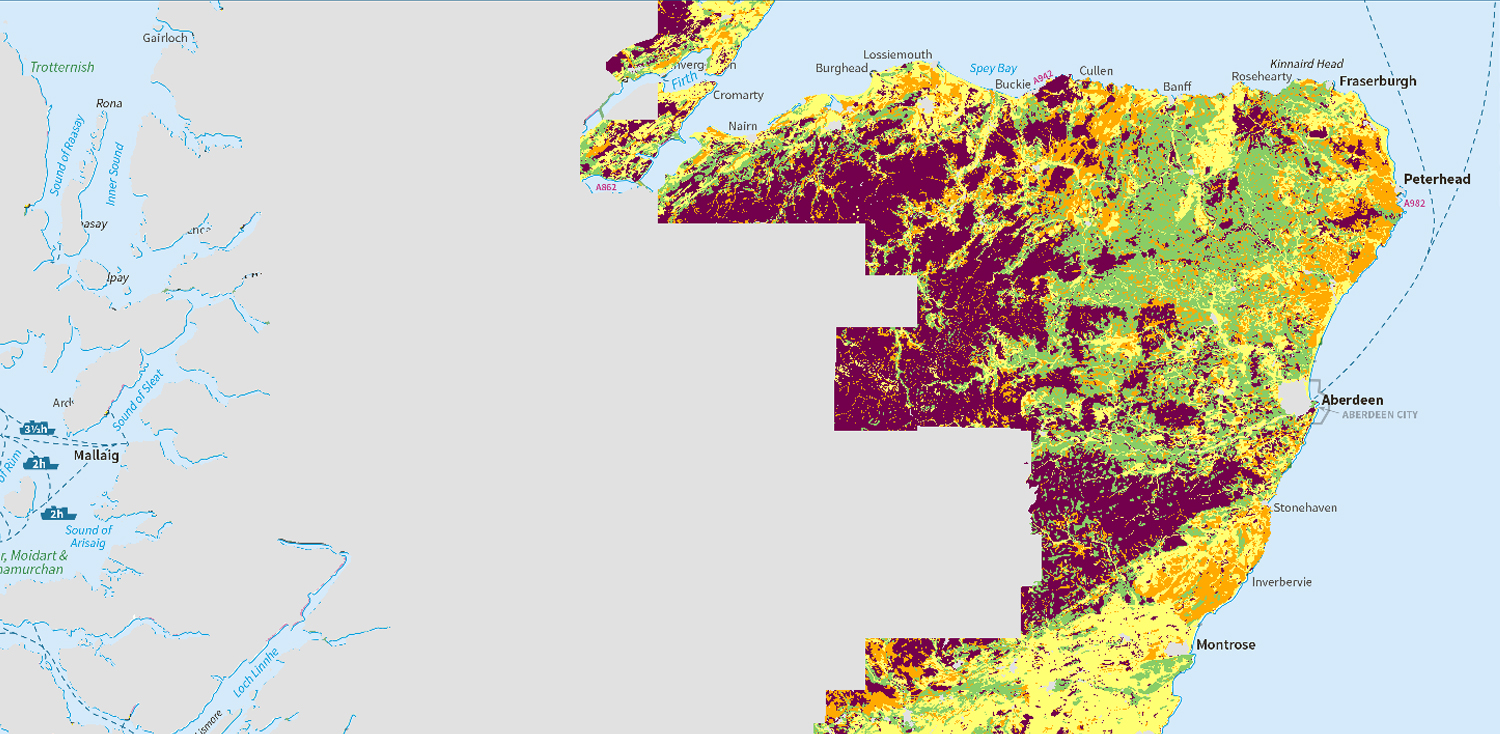
Carbon and peatland 2016 map
The map shows the distribution of carbon and peatland classes across the whole of Scotland.
Map of soil phosphorus sorption capacity
The map shows soil phosphorus sorption capacity by soil association for non-calcareous mineral soils.
Map of subsoil compaction risk (partial cover)
The map shows the vulnerability of subsoils to compaction by traffic. It covers most of Scotland’s cultivated agricultural land area.
Map of topsoil compaction risk (partial cover)
The map shows the risk of topsoil becoming compacted by traffic. It covers most of Scotland’s cultivated agricultural land area.
Map of soil erosion risk (partial cover)
The map shows the risk of a bare soil being eroded by water under intense or prolonged rainfall. It covers most of Scotland’s cultivated agricultural land area.
Map of soil leaching potential (partial cover)
The map shows the risk of potential pollutants and nutrients leaching through the soil to ground and surface waters. It covers most of Scotland’s cultivated agricultural land area.
Map of runoff risk (partial cover)
The map shows the risk of soil becoming saturated and causing water to flow over land (runoff), potentially carrying pollutants into water courses. It covers most of Scotland’s cultivated agricultural land area.
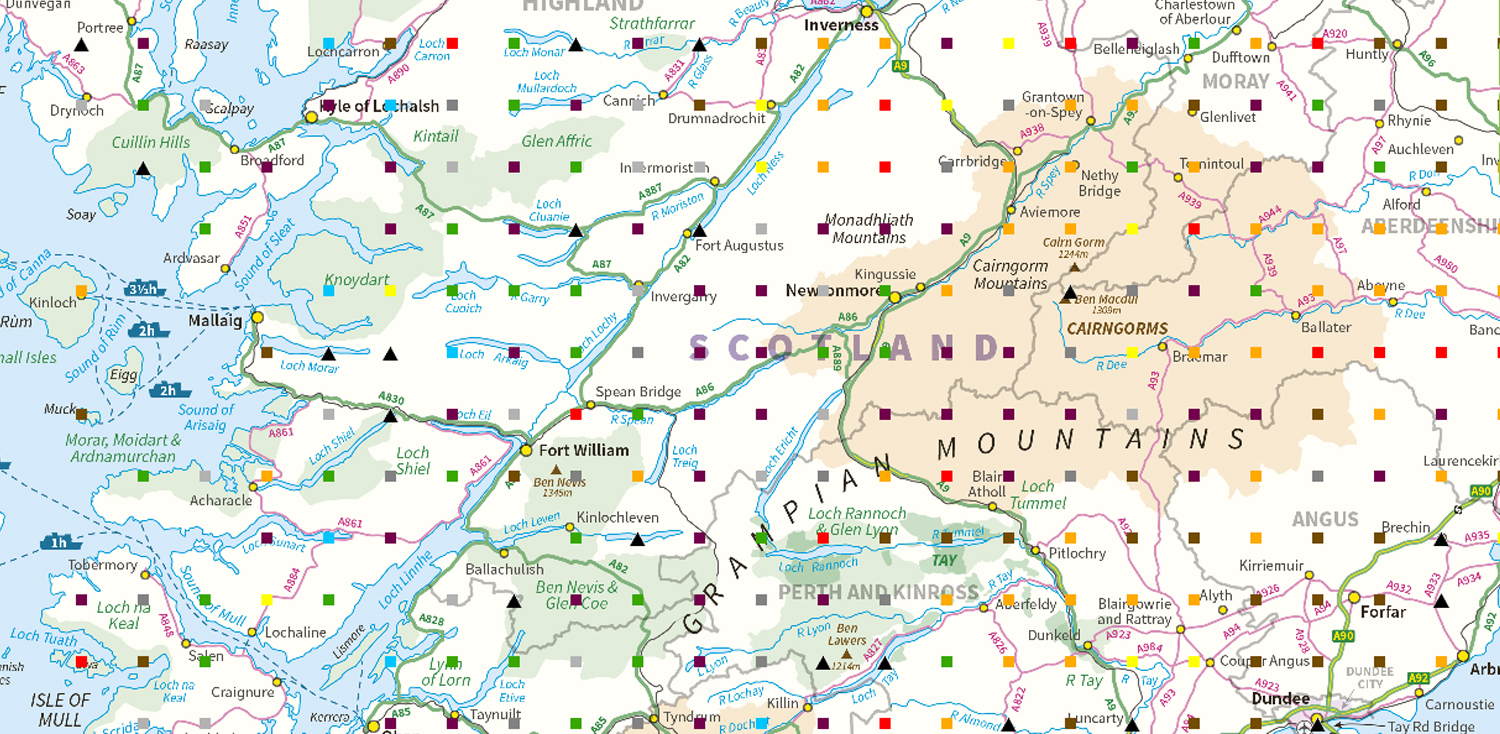
National Soil Inventory of Scotland (NSIS 1978-88)
This map shows the sampling locations of the National Soil Inventory of Scotland, classified by the soil type found at each location.
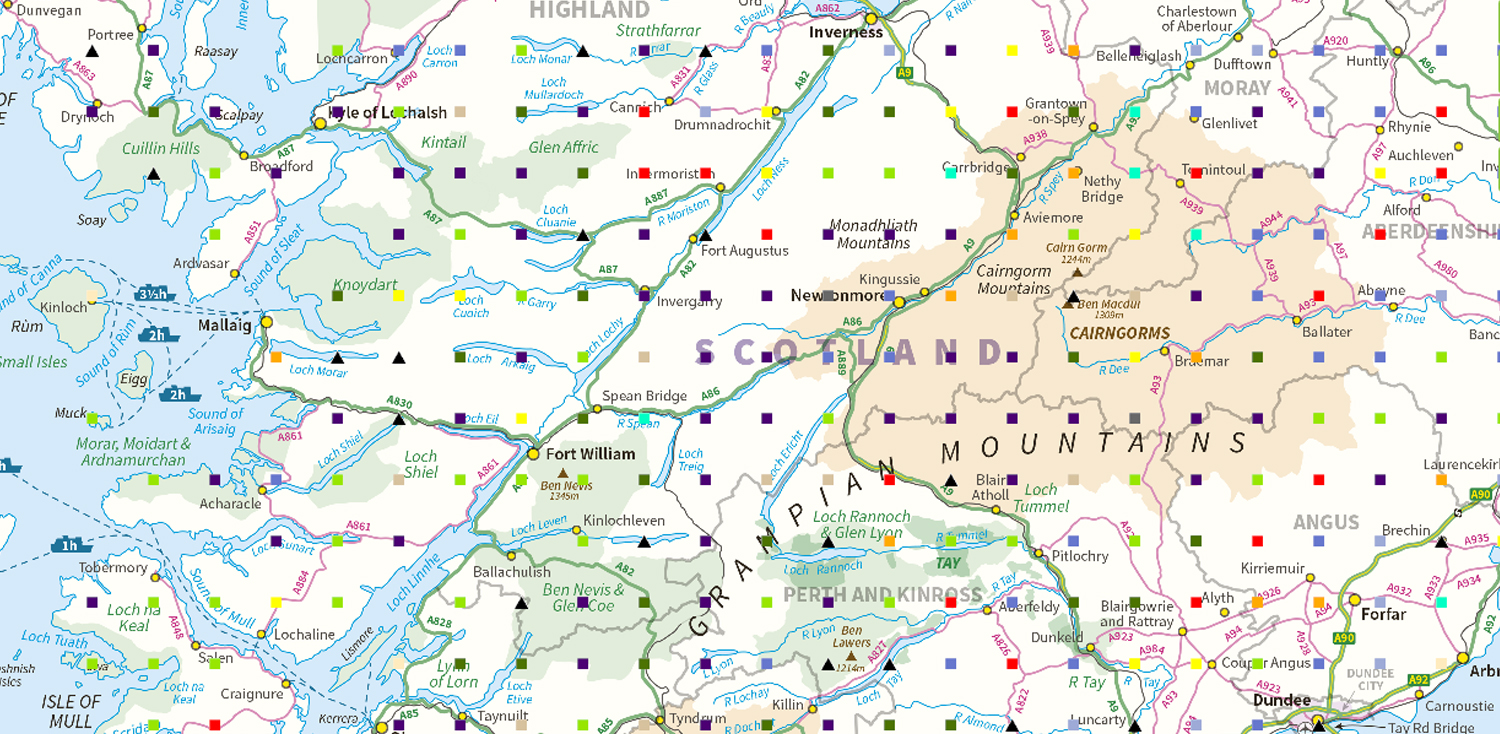
Parent material
This map shows the soil parent material found at each National Soil Inventory of Scotland sampling location.
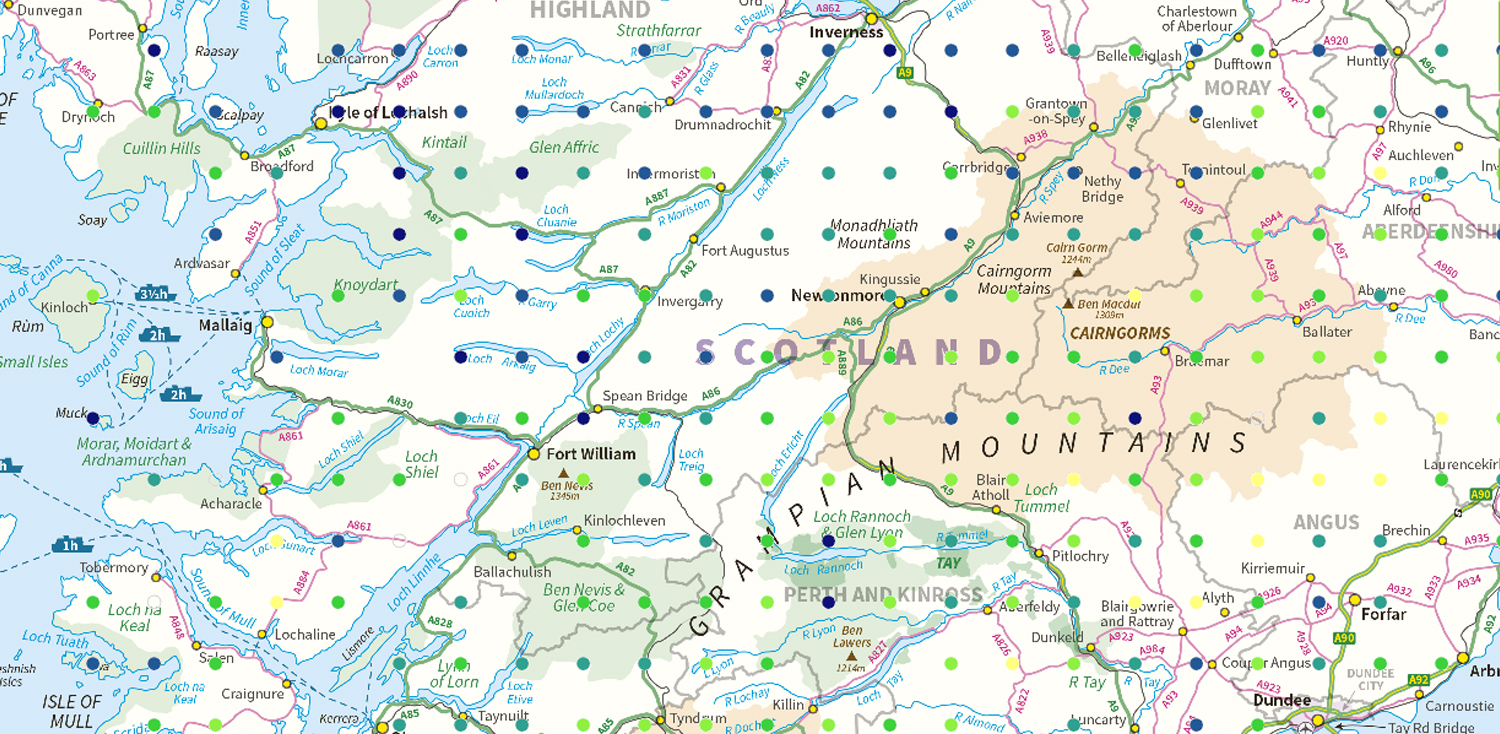
Topsoil lead (Pb) concentration
This map shows the location of the National Soil Inventory of Scotland sampling points. The colour of the symbol relates to the lead concentration of the topsoil found at that point (in parts per million of air-dried soil).
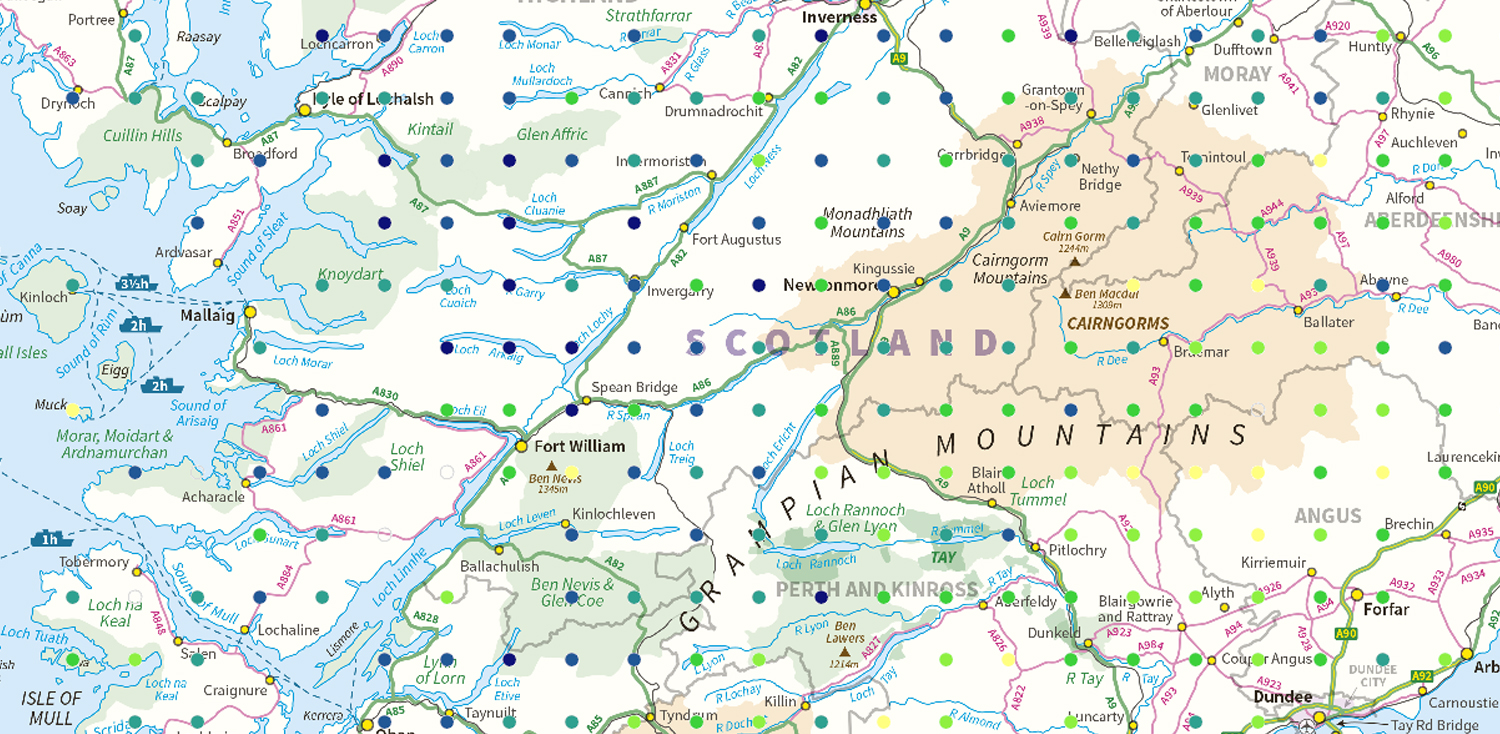
Topsoil zinc (Zn) concentration
The map shows the location of each National Soil Inventory of Scotland sampling point. The colour of the symbol relates to the zinc concentration of the topsoil found at that point (in parts per million of air-dried soil).
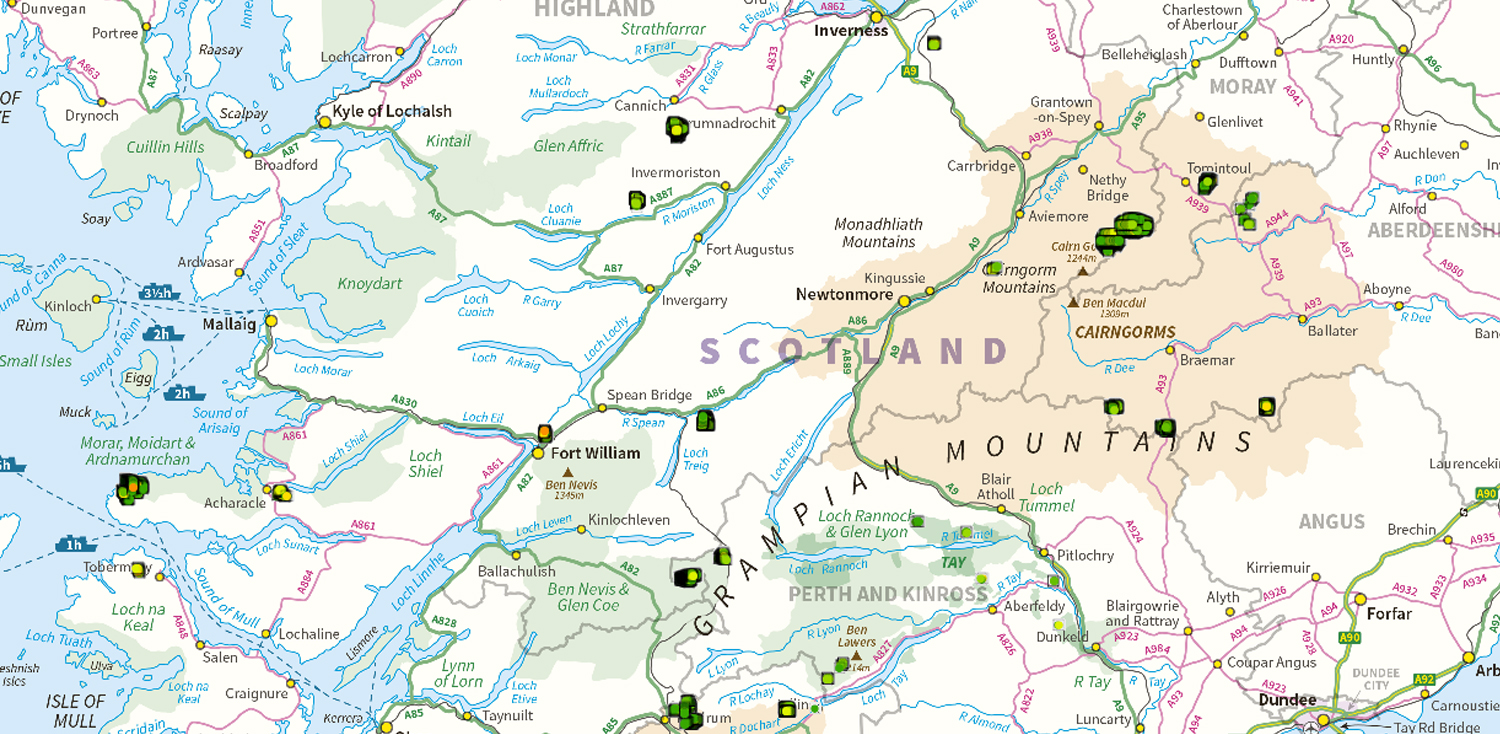
Peatland Action - peat depth
This map shows the locations where peat depth was recorded as part of the feasibility studies and baseline information collection for the Peatland Action restoration program.