View the map or download the data
What is it?
What do I see on my screen?
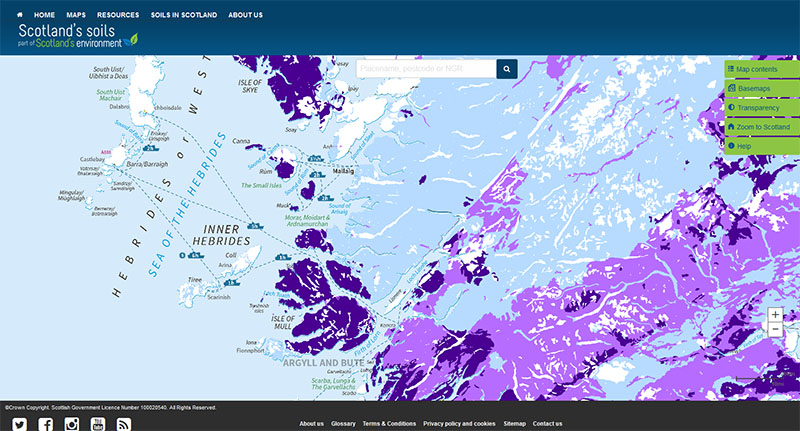
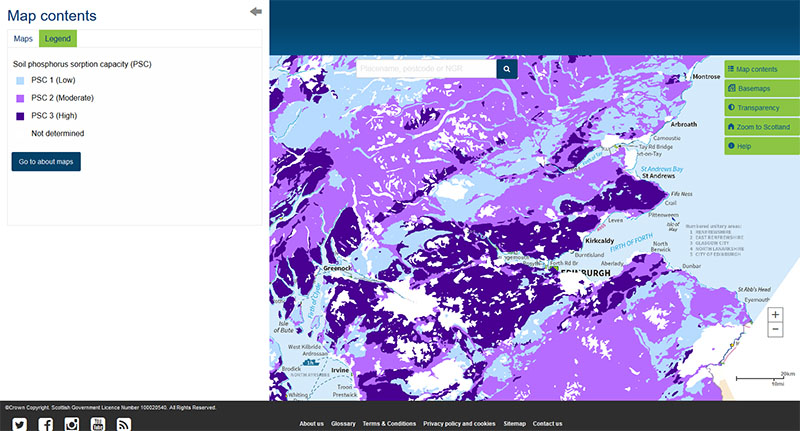
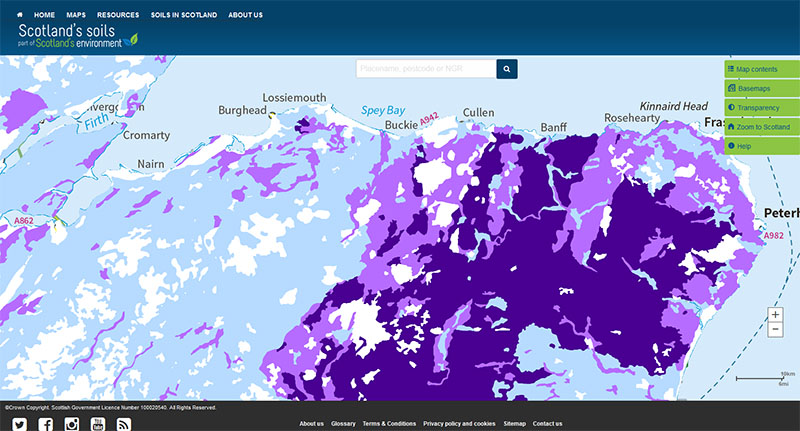
The map shows soil phosphorus sorption capacity by soil association for non-calcareous mineral soils.
Map legend
The soil phosphorus sorption capacity (PSC) is shown as PSC 1, 2 and 3 where 1 is low, 2 is moderate and 3 is high. Where no data were available, the areas are mapped as “not determined”.
 |
PSC 1 (Low) |
 |
PSC 2 (Moderate) |
 |
PSC 3 (High) |
 |
Not determined |
The phosphorus sorption capacity of a soil refers to the ability of the soil to bind phosphorus applied to it (e.g. as fertiliser). Soils with a high binding capacity will hold on to any phosphorus applied more tightly than soils with a low binding capacity. When phosphorus applied to soils binds to the soil particles then its not immediately available for plant uptake.
What is included in the digital dataset?
The dataset can be downloaded from the James Hutton Institute website. It provides information on phosphorus sorption capacity in 3 classes.
The soil phosphorus sorption capacity depends on the soil chemistry, texture, pH and organic matter content.
How was the map / dataset created?
The soil properties (pH, organic carbon content, clay content and oxalate extractable iron and aluminium concentrations) were determined from a dataset of 399 soils samples from 38 different soil Associations. This dataset included topsoil samples from the National Soil Inventory of Scotland (2007-9), various topsoil samples taken for other research projects and samples from the National Soils Archive. These properties were used to estimate the P sorption capacity of each soil Association using a model. These values were grouped into 3 categories of P sorption index from 1 (low) to 3 (high). Where no data were available, the areas are mapped as “not determined”.
How is it updated?
The map was first published in a research report for SEPA 'Assessing the potential risks to water quality from phosphate leaching' with PSC values of 1 – 5. It was then updated using categories of 1 - 3 in April 2015 for an SRUC technical note on Managing soil phosphorus .The map published on this website is the first digitally available version.
Using the map
What can I do?
You can click on the map, or insert a grid reference or post code, to find out the sorption capacity of the soil in that area. You can also download the map data from the James Hutton Institute data download page.
The map provides information on the sorption capacity of soil and can be used to help make decisions about the amount of fertiliser required to grow crops.
Be aware: This map is produced at a fixed scale; zooming-in does not change the resolution of the map.
Technical and reference material
'Assessing the potential risks to water quality from phosphate leaching '
Managing soil phosphorus SRUC technical note 668
Map of soil phosphorus sorption capacity metadata
This page was last updated on 14 Mar 2018
Adobe Acrobat Reader is the free, trusted leader for reliably viewing, annotating and signing PDFs.
Download Adobe Acrobat Reader


